29
/pt/
pt
AIzaSyAYiBZKx7MnpbEhh9jyipgxe19OcubqV5w
April 1, 2024
58829
Sub-Saharan Africa
SSF
false
2
1
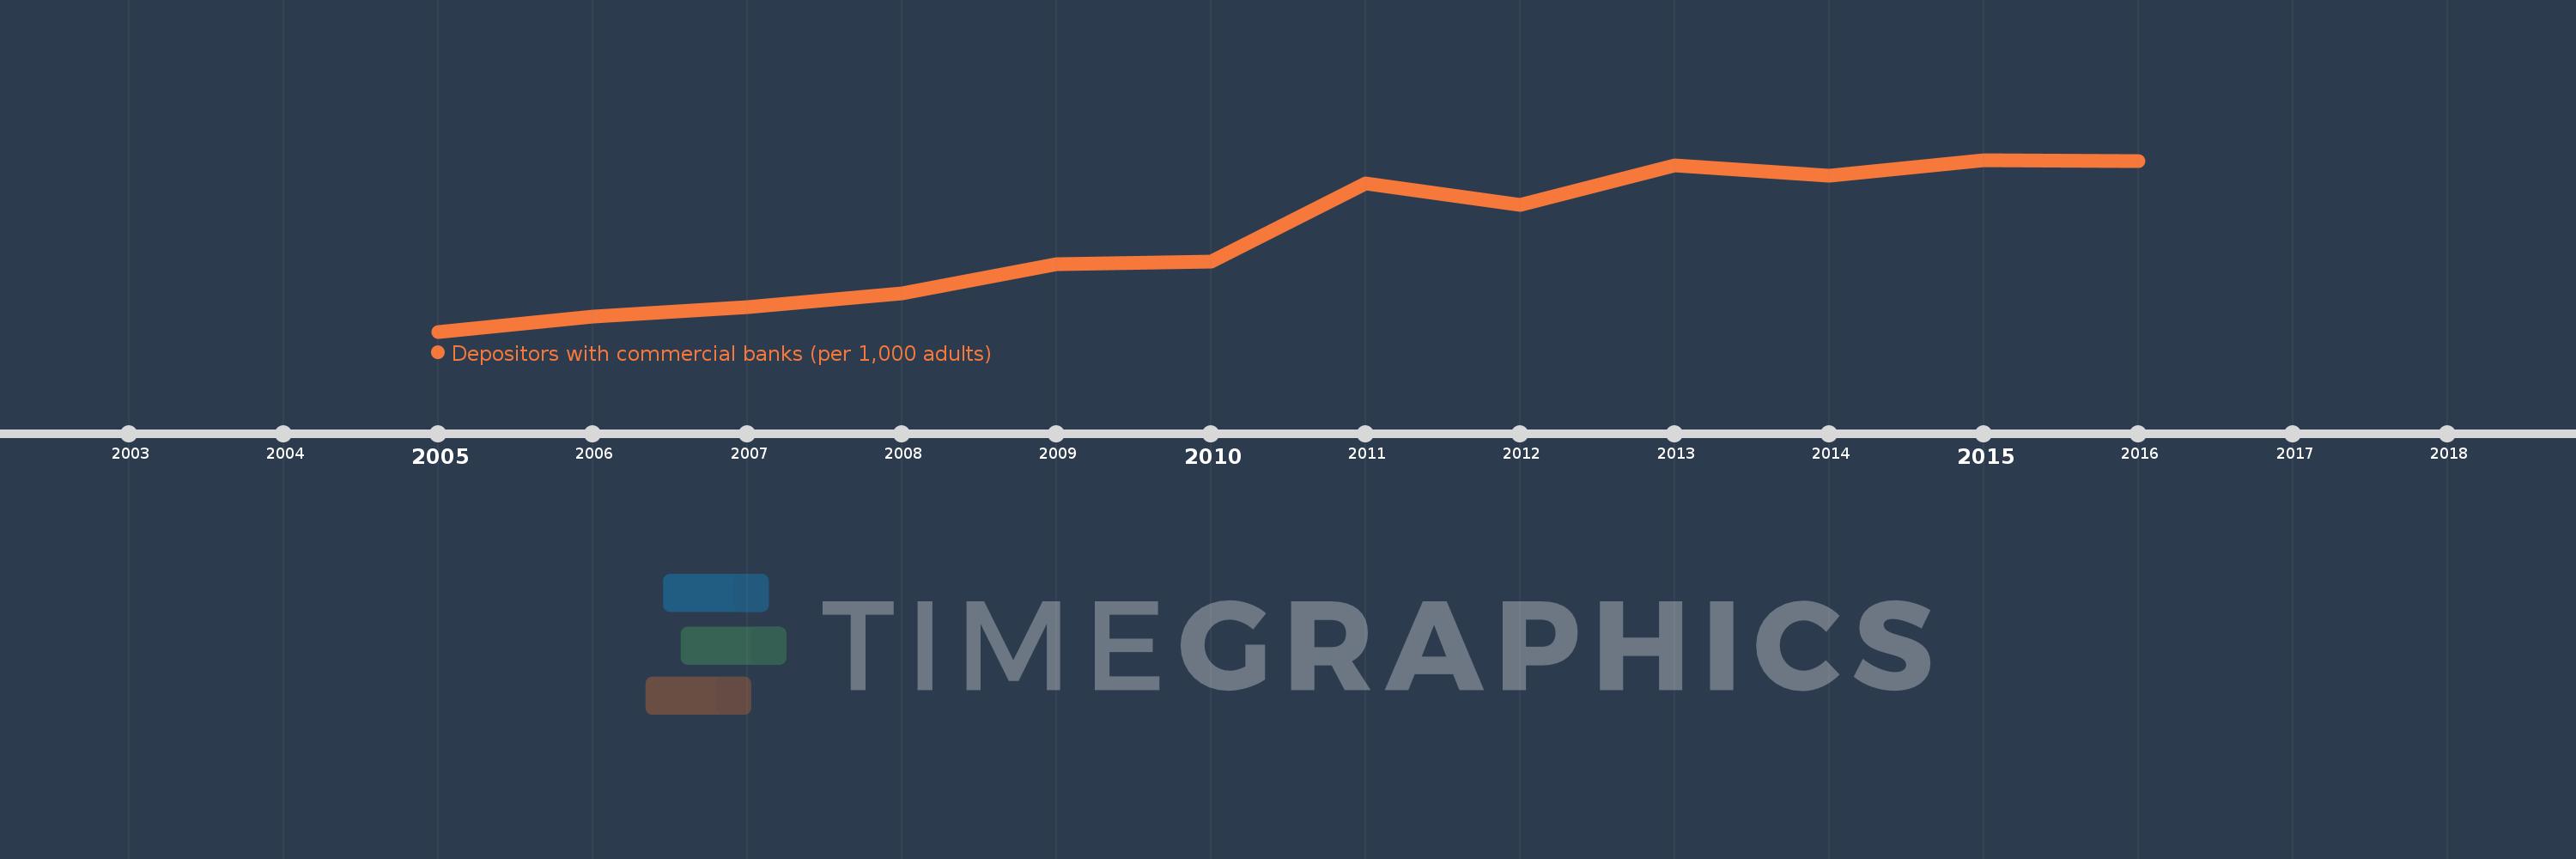
Depositors with commercial banks (per 1,000 adults)
2016,2015,2014,2013,2012,2011,2010,2009,2008,2007,2006,2005
Estas estatísticas em outros países:
Linha do tempo:
Nesta escala de tempo está apresentado um gráfico de 2005 ano até 2016 ano Sub-Saharan Africa . Dados de 2004 ano ausente. O número de observações reais por data: 12.
Fonte (nome):
Indicadores de desenvolvimento mundial
Fonte (organização):
International Monetary Fund, Financial Access Survey.
Categorias:
Financial Sector
Foi atualizado:
23 abr 2017 ano
Indicadores de alterações dos valores ao longo dos anos
Mínimo:
49.998
1 jan 2005 ano
Máximo:
155.368
1 jan 2015 ano
Na data de observação
Valor
Mudança absoluta
A alteração em relação ao valor anterior
1 jan 2005 ano
49.998
+49.998
0.0%
1 jan 2006 ano
59.021
+9.023
18.05%
1 jan 2007 ano
64.809
+5.788
9.81%
1 jan 2008 ano
73.631
+8.822
13.61%
1 jan 2009 ano
91.563
+17.932
24.35%
1 jan 2010 ano
92.719
+1.156
1.26%
1 jan 2011 ano
140.815
+48.096
51.87%
1 jan 2012 ano
127.52
-13.296
-9.44%
1 jan 2013 ano
152.196
+24.676
19.35%
1 jan 2014 ano
145.42
-6.776
-4.45%
1 jan 2015 ano
155.368
+9.948
6.84%
1 jan 2016 ano
154.796
-0.572
-0.37%
Classificação de países por estatísticas atuais por anos


Comentários: