29
/fr/
fr
AIzaSyAYiBZKx7MnpbEhh9jyipgxe19OcubqV5w
April 1, 2024
108408
Comoros
COM
true
2
1
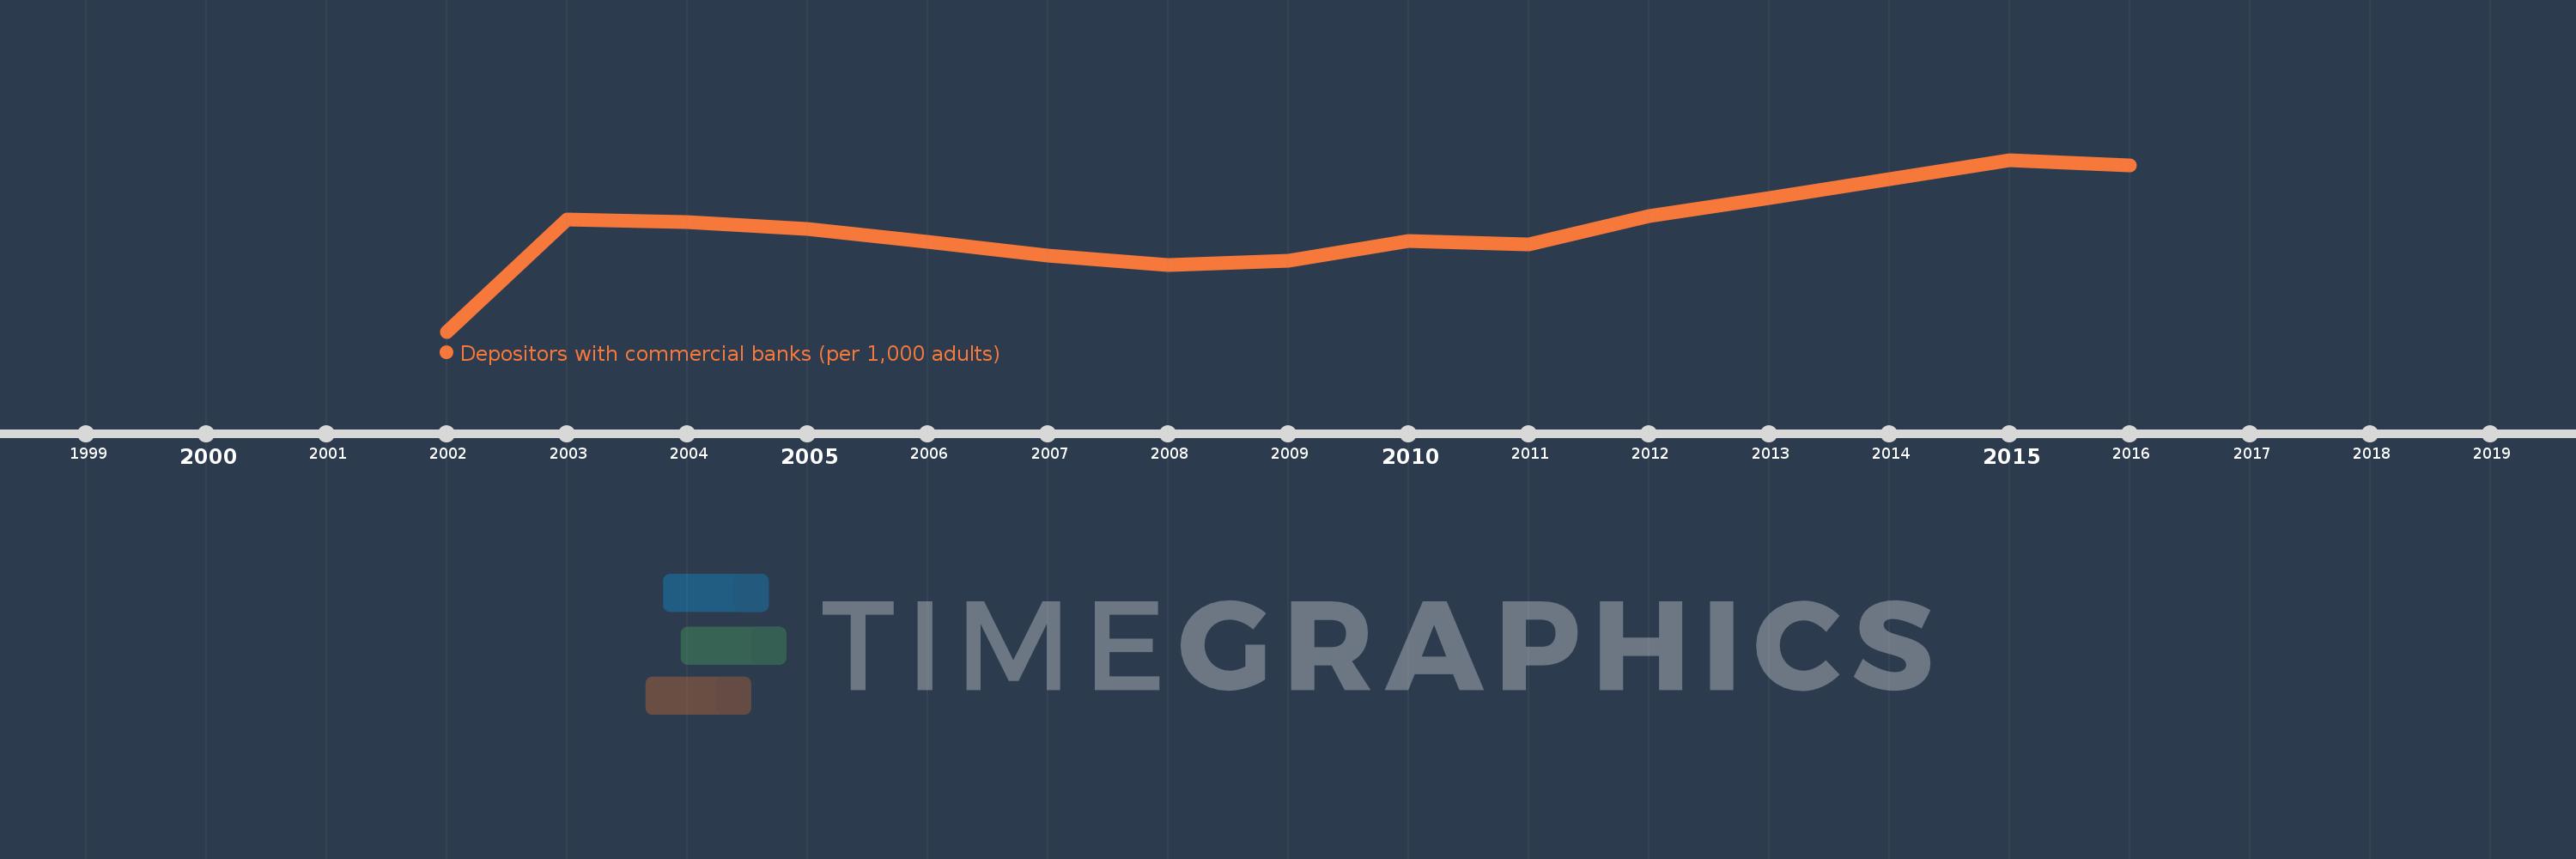
Depositors with commercial banks (per 1,000 adults)
2016,2015,2014,2013,2012,2011,2010,2009,2008,2007,2006,2005,2004,2003,2002
Cette statistique dans les autres pays:
La ligne de temps
Cette échelle de temps montre un graphique de 2002 année à 2016 année Comoros. Les données jusqu'à 2001 année ne sont pas présentés. Quantité d'observations actuelles selon dates: 15.
Source (désignation):
Les indicateurs du développement mondiale
Source (organisation):
International Monetary Fund, Financial Access Survey.
Catégories:
Financial Sector
Dernière mise à jour
23 avr. 2017
Les indicateurs de changement de valeurs selon les années
Maximum:
118.169
1 janv. 2015
Pour la date d''observation
Valeur
Changement absolu
Le changement par rapport à la valeur précédente
1 janv. 2003
76.971
+76.971
%
1 janv. 2004
75.288
-1.683
-2.19%
1 janv. 2005
70.782
-4.505
-5.98%
1 janv. 2006
61.495
-9.287
-13.12%
1 janv. 2007
52.269
-9.226
-15.0%
1 janv. 2008
45.502
-6.768
-12.95%
1 janv. 2009
48.788
+3.286
7.22%
1 janv. 2010
62.045
+13.257
27.17%
1 janv. 2011
60.106
-1.939
-3.13%
1 janv. 2012
79.402
+19.297
32.1%
1 janv. 2013
92.021
+12.618
15.89%
1 janv. 2014
104.912
+12.892
14.01%
1 janv. 2015
118.169
+13.257
12.64%
1 janv. 2016
114.589
-3.58
-3.03%
Classement des pays selon les statistiques actuelles par années


Commentaires: