29
/fr/
fr
AIzaSyAYiBZKx7MnpbEhh9jyipgxe19OcubqV5w
April 1, 2024
62496
World
WLD
false
2
1
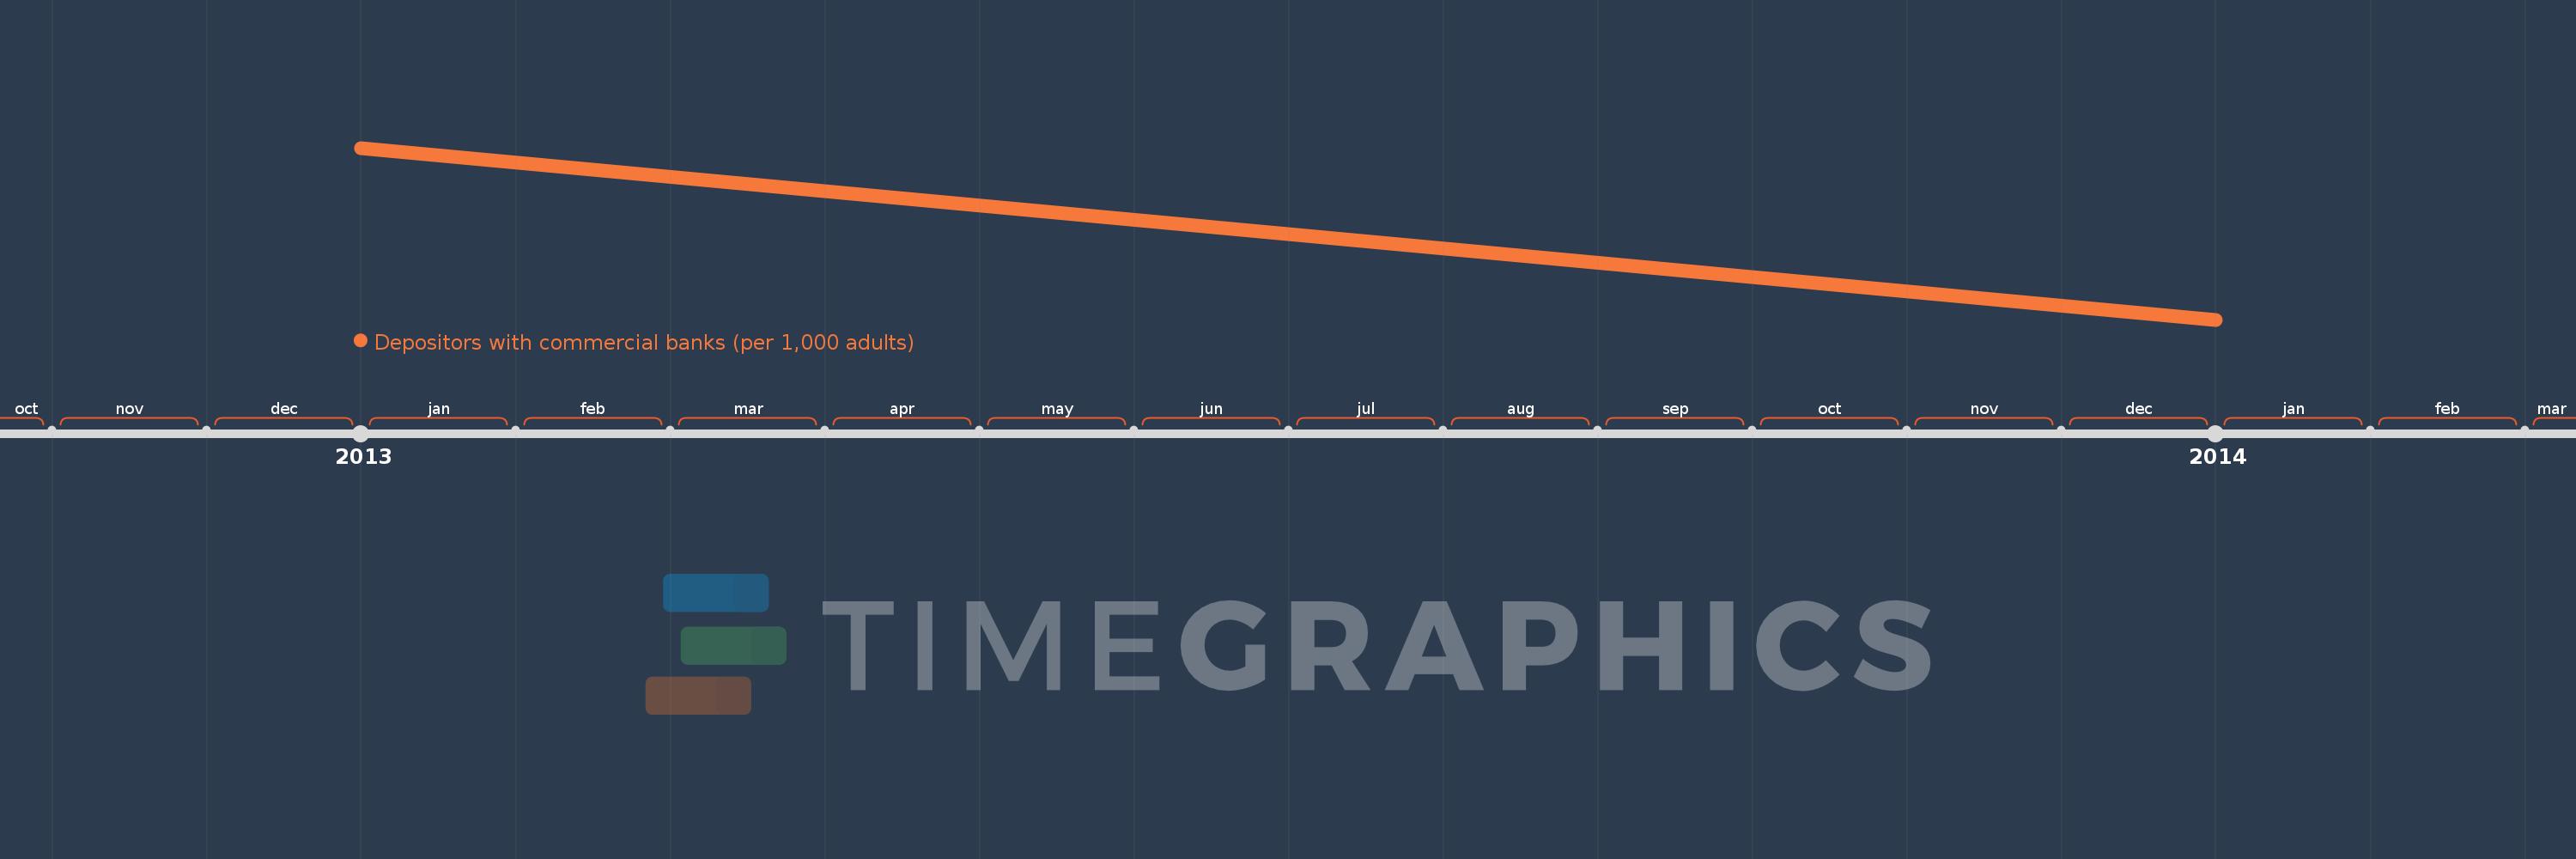
Depositors with commercial banks (per 1,000 adults)
2014,2013
Cette statistique dans les autres pays:
La ligne de temps
Cette échelle de temps montre un graphique de 2013 année à 2014 année World. Les données jusqu'à 2012 année ne sont pas présentés. Quantité d'observations actuelles selon dates: 2.
Source (désignation):
Les indicateurs du développement mondiale
Source (organisation):
International Monetary Fund, Financial Access Survey.
Catégories:
Financial Sector
Dernière mise à jour
23 avr. 2017
Les indicateurs de changement de valeurs selon les années
Minimum:
458.125
1 janv. 2014
Maximum:
459.365
1 janv. 2013
Pour la date d''observation
Valeur
Changement absolu
Le changement par rapport à la valeur précédente
1 janv. 2013
459.365
+459.365
0.0%
1 janv. 2014
458.125
-1.24
-0.27%
Classement des pays selon les statistiques actuelles par années


Commentaires: