29
/fr/
fr
AIzaSyAYiBZKx7MnpbEhh9jyipgxe19OcubqV5w
April 1, 2024
185039
Madagascar
MDG
true
2
1
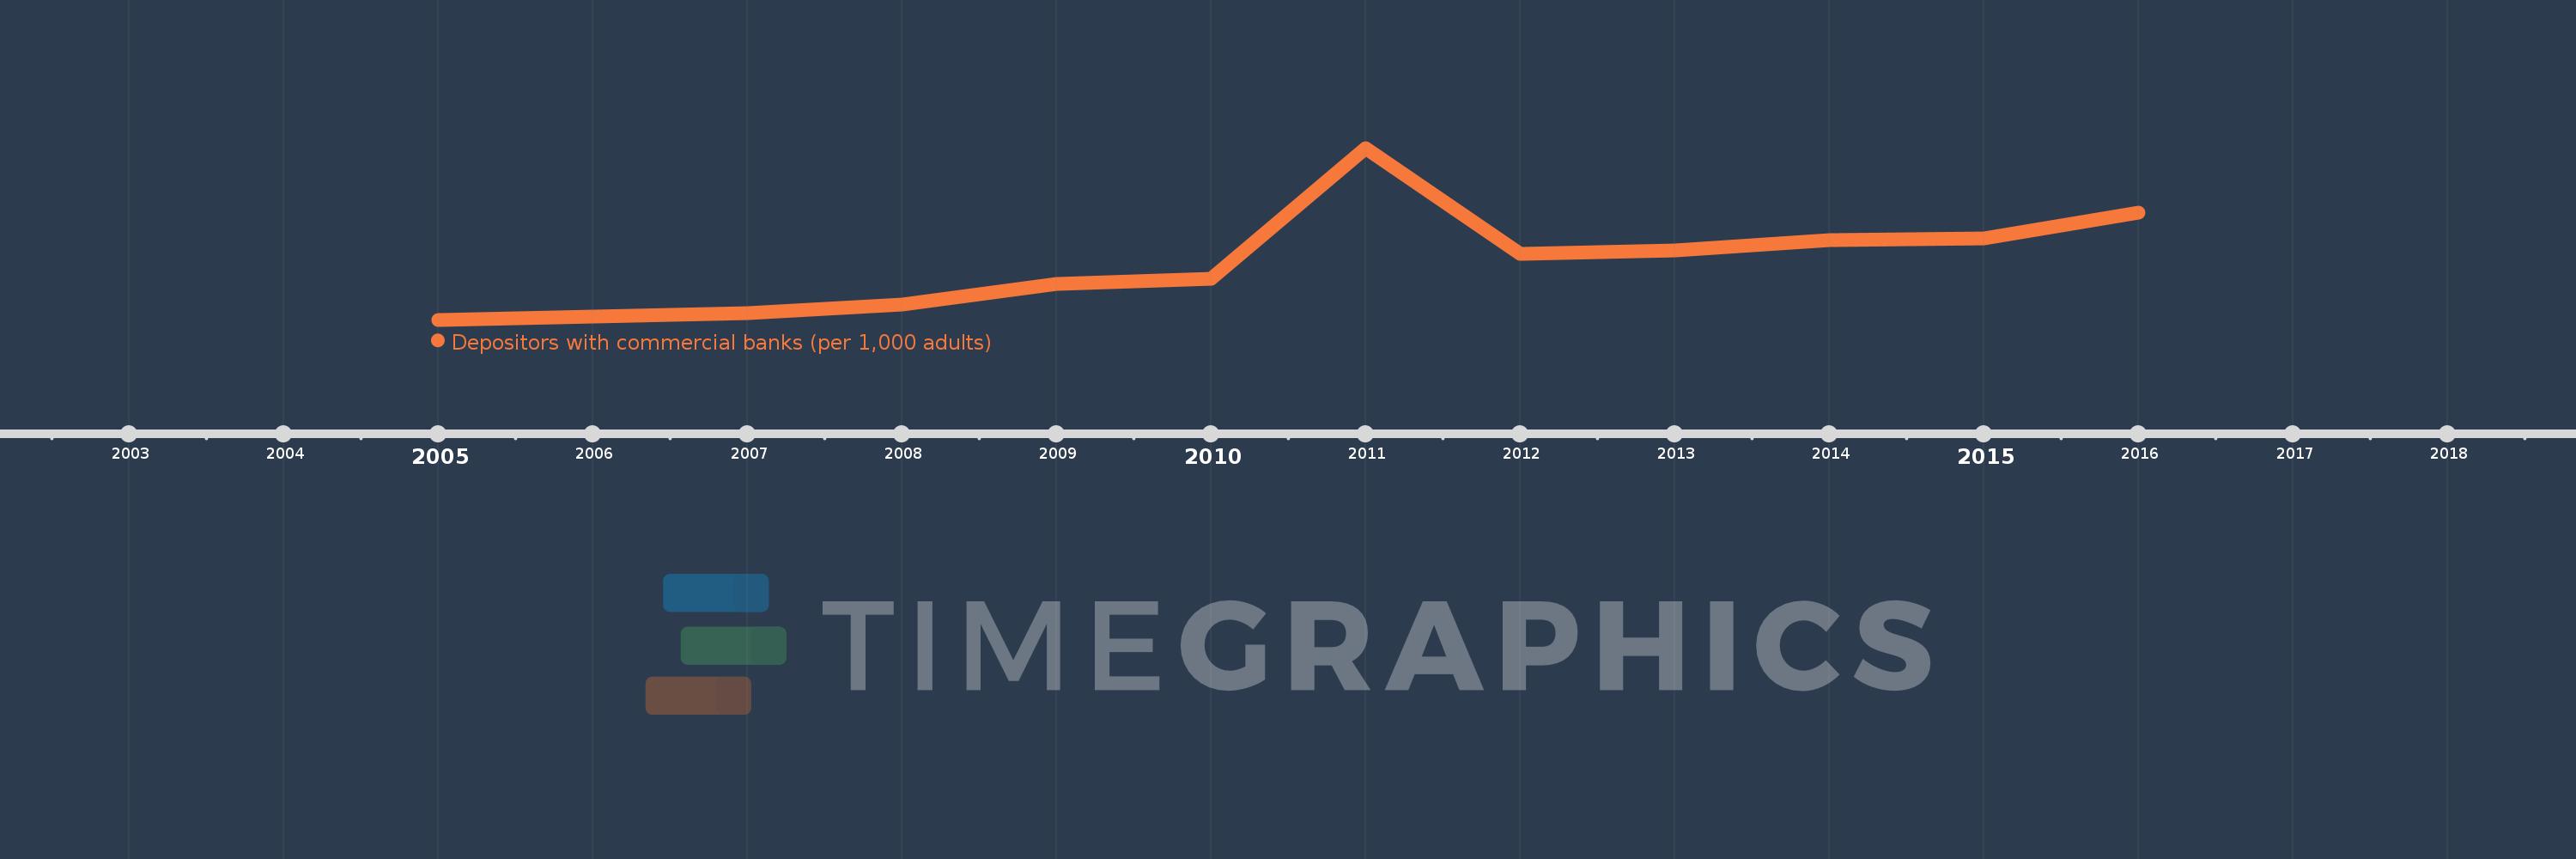
Depositors with commercial banks (per 1,000 adults)
2016,2015,2014,2013,2012,2011,2010,2009,2008,2007,2006,2005
Cette statistique dans les autres pays:
La ligne de temps
Cette échelle de temps montre un graphique de 2005 année à 2016 année Madagascar. Les données jusqu'à 2004 année ne sont pas présentés. Quantité d'observations actuelles selon dates: 12.
Source (désignation):
Les indicateurs du développement mondiale
Source (organisation):
International Monetary Fund, Financial Access Survey.
Catégories:
Financial Sector
Dernière mise à jour
23 avr. 2017
Les indicateurs de changement de valeurs selon les années
Minimum:
18.587
1 janv. 2005
Maximum:
106.472
1 janv. 2011
Pour la date d''observation
Valeur
Changement absolu
Le changement par rapport à la valeur précédente
1 janv. 2005
18.587
+18.587
0.0%
1 janv. 2006
20.115
+1.528
8.22%
1 janv. 2007
21.872
+1.757
8.73%
1 janv. 2008
26.467
+4.596
21.01%
1 janv. 2009
36.938
+10.47
39.56%
1 janv. 2010
39.724
+2.787
7.54%
1 janv. 2011
106.472
+66.748
168.03%
1 janv. 2012
52.31
-54.163
-50.87%
1 janv. 2013
53.944
+1.635
3.13%
1 janv. 2014
59.378
+5.434
10.07%
1 janv. 2015
60.186
+0.808
1.36%
1 janv. 2016
73.469
+13.283
22.07%
Classement des pays selon les statistiques actuelles par années


Commentaires: