29
/it/
it
AIzaSyAYiBZKx7MnpbEhh9jyipgxe19OcubqV5w
April 1, 2024
94268
Bulgaria
BGR
true
2
1
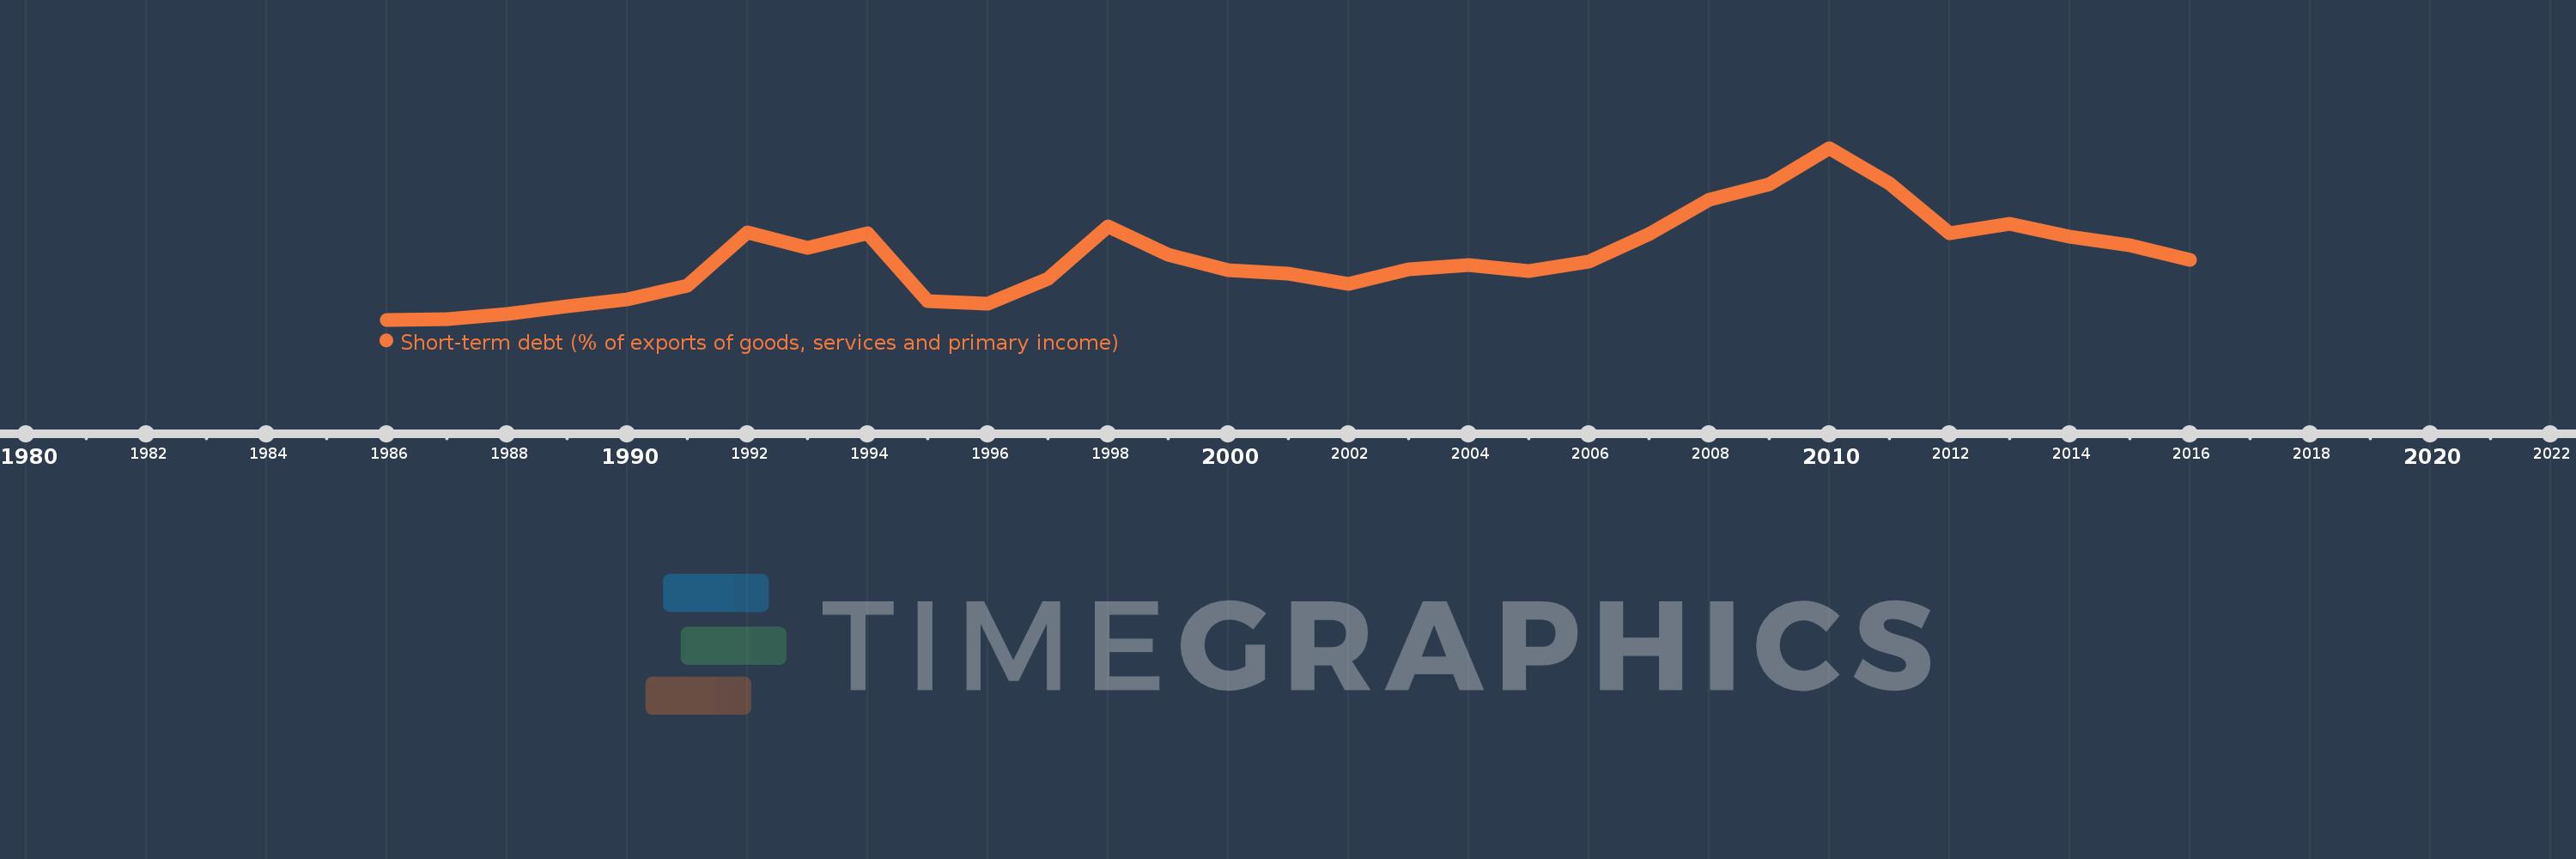
Short-term debt (% of exports of goods, services and primary income)
2016,2015,2014,2013,2012,2011,2010,2009,2008,2007,2006,2005,2004,2003,2002,2001,2000,1999,1998,1997,1996,1995,1994,1993,1992,1991,1990,1989,1988,1987,1986
Queste statistiche in altri paesi:
Linea del tempo:
Questa scala temporale mostra un grafico dal 1986 anno al 2016 anno. Bulgaria. I dati fino ad 1985 anno non disponibili. Il numero di osservazioni attuali secondo i date: 31.
La fonte (nome):
Indicatori dello sviluppo mondiale
La fonte (organizzazione):
World Bank, International Debt Statistics.
Categorie:
Economy & Growth, External Debt
sono stati aggiornati
23 apr 2017 anni
Indicatori delle variazioni dei valori per anni
Minima:
0.434
1 gen 1986 anni
Massimo:
72.985
1 gen 2010 anni
Alla data di osservazione
Valore
Variazione assoluta
La variazione rispetto al valore precedente
1 gen 1986 anni
0.434
+0.434
0.0%
1 gen 1987 anni
0.603
+0.169
38.82%
1 gen 1988 anni
3.034
+2.431
403.49%
1 gen 1989 anni
5.962
+2.928
96.51%
1 gen 1990 anni
8.879
+2.918
48.94%
1 gen 1991 anni
14.93
+6.05
68.14%
1 gen 1992 anni
37.373
+22.443
150.33%
1 gen 1993 anni
30.943
-6.43
-17.21%
1 gen 1994 anni
37.123
+6.181
19.97%
1 gen 1995 anni
8.261
-28.862
-77.75%
1 gen 1996 anni
7.396
-0.865
-10.47%
1 gen 1997 anni
17.815
+10.419
140.87%
1 gen 1998 anni
39.702
+21.887
122.85%
1 gen 1999 anni
28.033
-11.669
-29.39%
1 gen 2000 anni
21.259
-6.775
-24.17%
1 gen 2001 anni
19.818
-1.441
-6.78%
1 gen 2002 anni
15.452
-4.365
-22.03%
1 gen 2003 anni
21.769
+6.316
40.88%
1 gen 2004 anni
23.516
+1.747
8.03%
1 gen 2005 anni
21.107
-2.409
-10.24%
1 gen 2006 anni
25.136
+4.029
19.09%
1 gen 2007 anni
36.592
+11.456
45.58%
1 gen 2008 anni
51.065
+14.473
39.55%
1 gen 2009 anni
57.479
+6.414
12.56%
1 gen 2010 anni
72.985
+15.506
26.98%
1 gen 2011 anni
57.923
-15.062
-20.64%
1 gen 2012 anni
36.811
-21.112
-36.45%
1 gen 2013 anni
41.02
+4.209
11.44%
1 gen 2014 anni
35.457
-5.564
-13.56%
1 gen 2015 anni
31.778
-3.679
-10.38%
1 gen 2016 anni
25.833
-5.945
-18.71%
Classificazione dei paesi secondo i statistiche attuali per anni


Commenti: