29
/it/
it
AIzaSyAYiBZKx7MnpbEhh9jyipgxe19OcubqV5w
April 1, 2024
185913
Madagascar
MDG
true
2
1
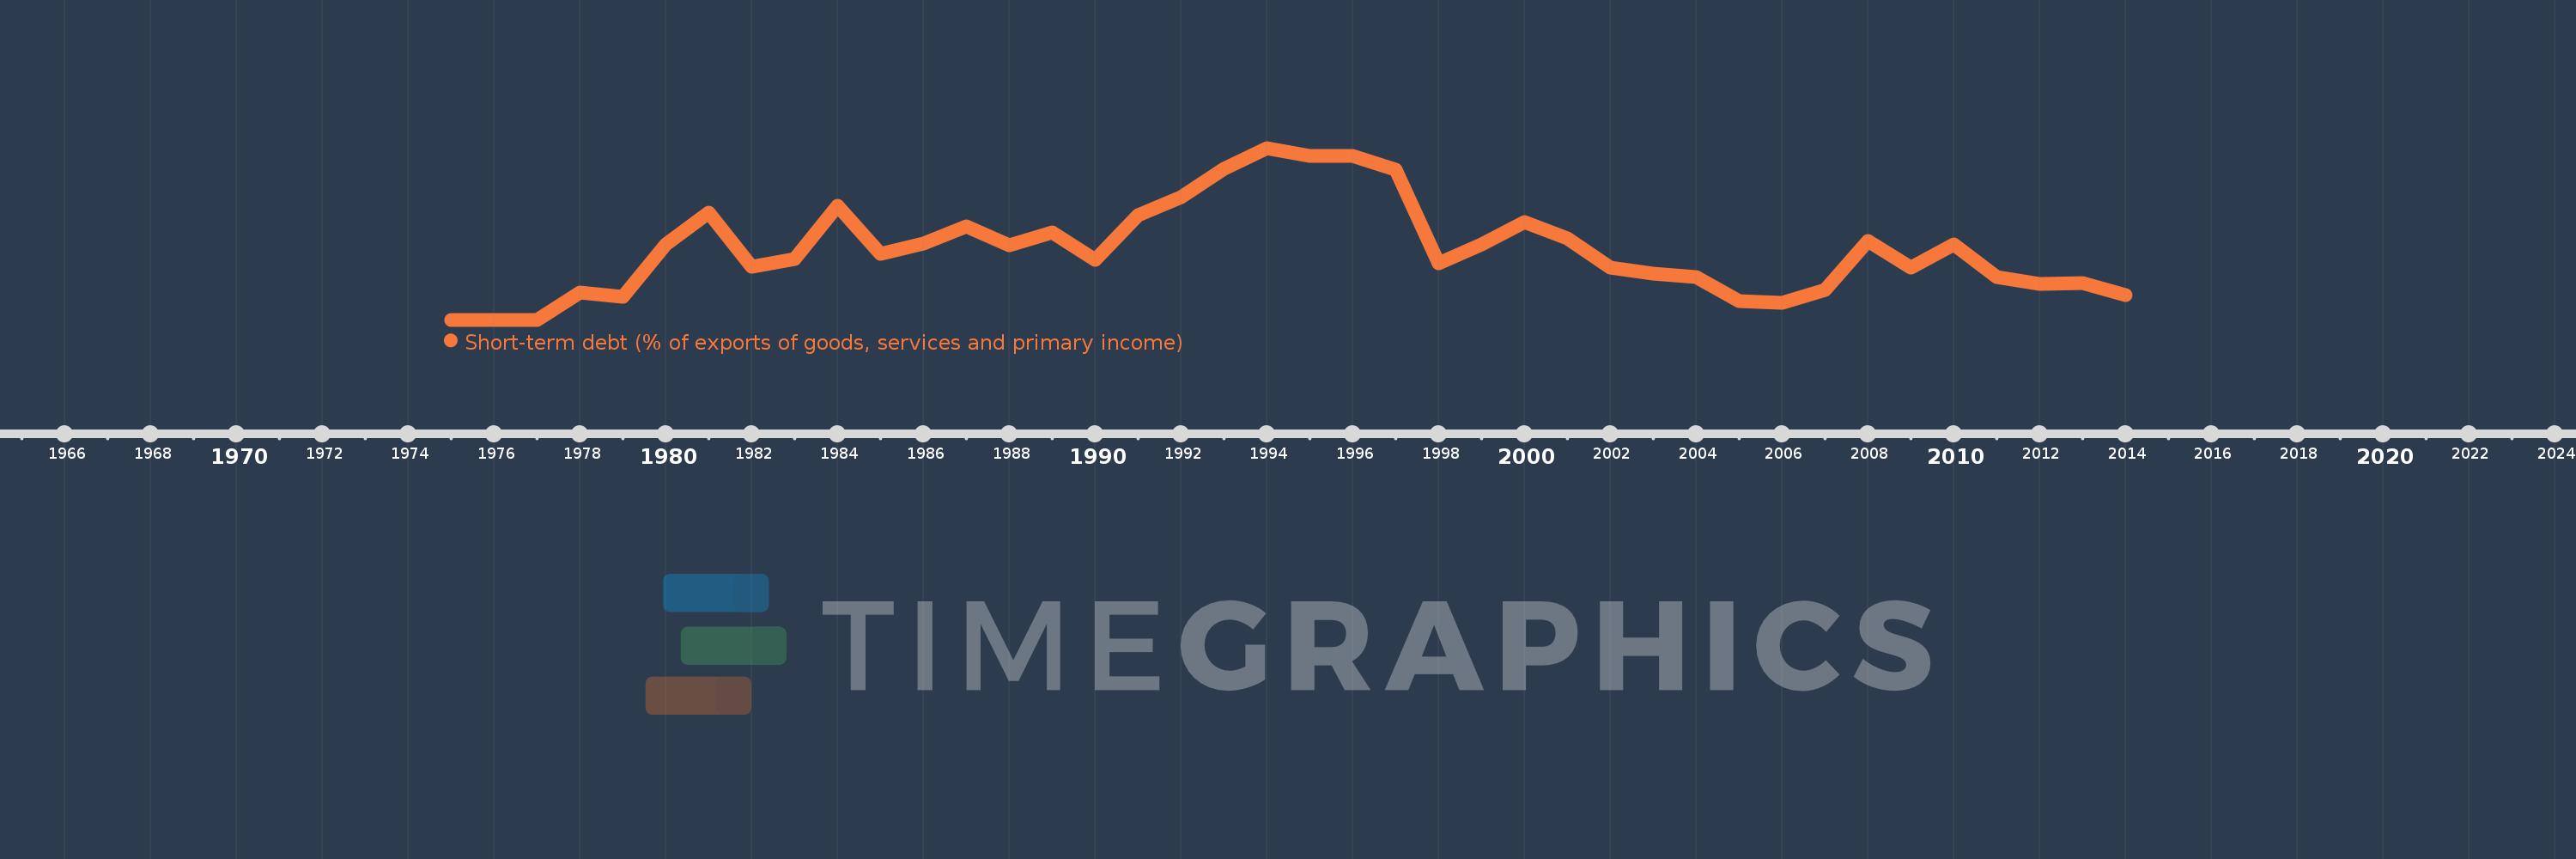
Short-term debt (% of exports of goods, services and primary income)
2014,2013,2012,2011,2010,2009,2008,2007,2006,2005,2004,2003,2002,2001,2000,1999,1998,1997,1996,1995,1994,1993,1992,1991,1990,1989,1988,1987,1986,1985,1984,1983,1982,1981,1980,1979,1978,1977,1976,1975
Queste statistiche in altri paesi:
Linea del tempo:
Questa scala temporale mostra un grafico dal 1975 anno al 2014 anno. Madagascar. I dati fino ad 1974 anno non disponibili. Il numero di osservazioni attuali secondo i date: 40.
La fonte (nome):
Indicatori dello sviluppo mondiale
La fonte (organizzazione):
World Bank, International Debt Statistics.
Categorie:
Economy & Growth, External Debt
sono stati aggiornati
23 apr 2017 anni
Indicatori delle variazioni dei valori per anni
Minima:
0.029
1 gen 1976 anni
Massimo:
75.554
1 gen 1994 anni
Alla data di osservazione
Valore
Variazione assoluta
La variazione rispetto al valore precedente
1 gen 1975 anni
0.038
+0.038
0.0%
1 gen 1976 anni
0.029
-0.008
-22.25%
1 gen 1977 anni
0.033
+0.003
10.91%
1 gen 1978 anni
11.9
+11.868
36.32 Mille.%
1 gen 1979 anni
10.16
-1.741
-14.63%
1 gen 1980 anni
33.317
+23.157
227.94%
1 gen 1981 anni
46.999
+13.682
41.06%
1 gen 1982 anni
23.183
-23.816
-50.67%
1 gen 1983 anni
26.826
+3.643
15.71%
1 gen 1984 anni
49.996
+23.17
86.37%
1 gen 1985 anni
28.85
-21.146
-42.3%
1 gen 1986 anni
33.398
+4.548
15.77%
1 gen 1987 anni
41.083
+7.686
23.01%
1 gen 1988 anni
32.914
-8.17
-19.89%
1 gen 1989 anni
38.356
+5.442
16.53%
1 gen 1990 anni
26.194
-12.162
-31.71%
1 gen 1991 anni
45.883
+19.689
75.17%
1 gen 1992 anni
53.827
+7.945
17.32%
1 gen 1993 anni
66.414
+12.586
23.38%
1 gen 1994 anni
75.554
+9.141
13.76%
1 gen 1995 anni
72.067
-3.488
-4.62%
1 gen 1996 anni
71.898
-0.169
-0.23%
1 gen 1997 anni
66.166
-5.732
-7.97%
1 gen 1998 anni
24.911
-41.255
-62.35%
1 gen 1999 anni
32.959
+8.048
32.31%
1 gen 2000 anni
43.116
+10.157
30.82%
1 gen 2001 anni
35.655
-7.461
-17.31%
1 gen 2002 anni
23.024
-12.631
-35.42%
1 gen 2003 anni
20.451
-2.573
-11.18%
1 gen 2004 anni
18.889
-1.561
-7.63%
1 gen 2005 anni
8.134
-10.755
-56.94%
1 gen 2006 anni
7.307
-0.827
-10.16%
1 gen 2007 anni
13.227
+5.92
81.01%
1 gen 2008 anni
34.8
+21.574
163.1%
1 gen 2009 anni
22.881
-11.919
-34.25%
1 gen 2010 anni
33.189
+10.308
45.05%
1 gen 2011 anni
18.943
-14.246
-42.92%
1 gen 2012 anni
15.75
-3.193
-16.86%
1 gen 2013 anni
16.15
+0.4
2.54%
1 gen 2014 anni
10.767
-5.383
-33.33%
Classificazione dei paesi secondo i statistiche attuali per anni


Commenti: