29
/it/
it
AIzaSyAYiBZKx7MnpbEhh9jyipgxe19OcubqV5w
April 1, 2024
83487
Belize
BLZ
true
2
1
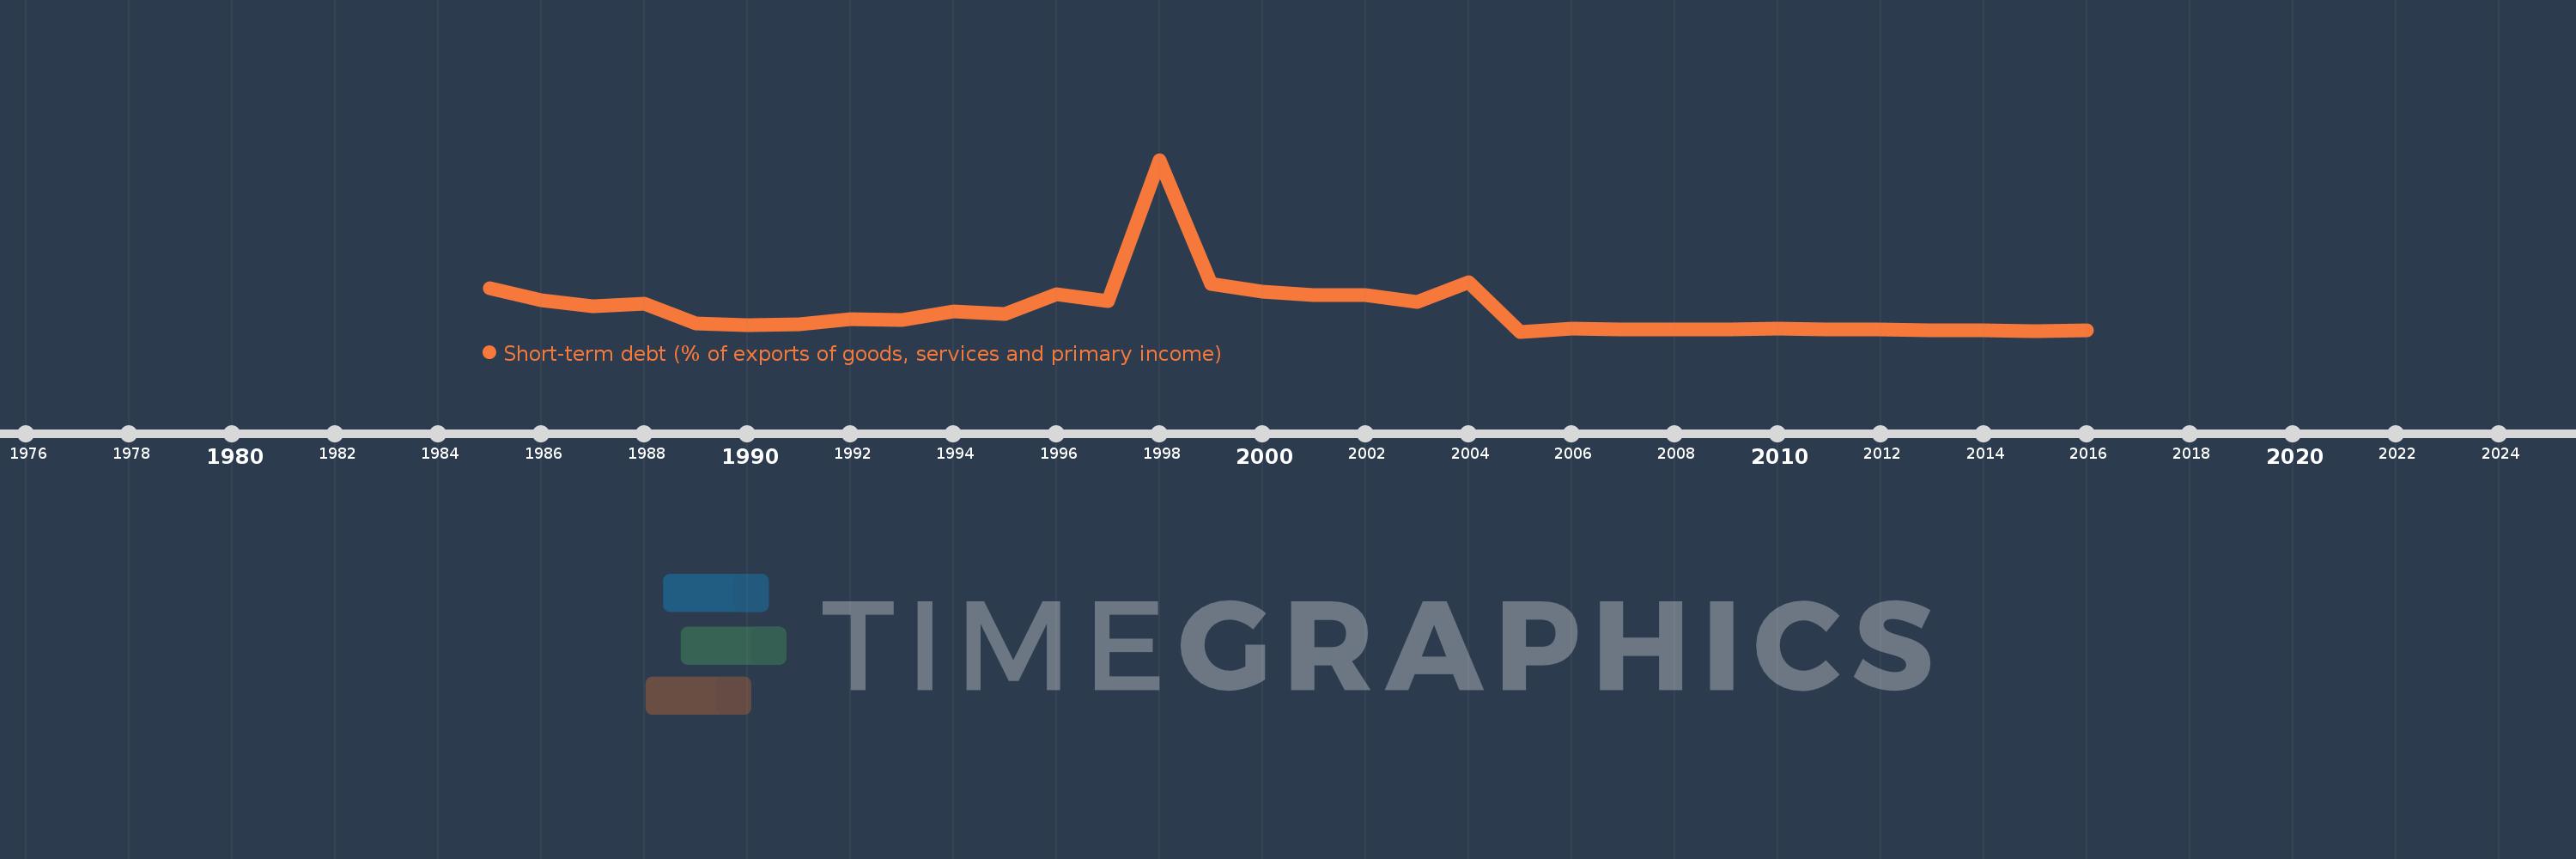
Short-term debt (% of exports of goods, services and primary income)
2016,2015,2014,2013,2012,2011,2010,2009,2008,2007,2006,2005,2004,2003,2002,2001,2000,1999,1998,1997,1996,1995,1994,1993,1992,1991,1990,1989,1988,1987,1986,1985
Queste statistiche in altri paesi:
Linea del tempo:
Questa scala temporale mostra un grafico dal 1985 anno al 2016 anno. Belize. I dati fino ad 1984 anno non disponibili. Il numero di osservazioni attuali secondo i date: 32.
La fonte (nome):
Indicatori dello sviluppo mondiale
La fonte (organizzazione):
World Bank, International Debt Statistics.
Categorie:
Economy & Growth, External Debt
sono stati aggiornati
23 apr 2017 anni
Indicatori delle variazioni dei valori per anni
Minima:
0.245
1 gen 2005 anni
Massimo:
53.741
1 gen 1998 anni
Alla data di osservazione
Valore
Variazione assoluta
La variazione rispetto al valore precedente
1 gen 1985 anni
13.822
+13.822
0.0%
1 gen 1986 anni
10.113
-3.709
-26.84%
1 gen 1987 anni
8.233
-1.88
-18.59%
1 gen 1988 anni
8.965
+0.732
8.9%
1 gen 1989 anni
2.715
-6.25
-69.71%
1 gen 1990 anni
2.311
-0.404
-14.88%
1 gen 1991 anni
2.389
+0.077
3.35%
1 gen 1992 anni
4.186
+1.797
75.23%
1 gen 1993 anni
3.793
-0.393
-9.39%
1 gen 1994 anni
6.566
+2.773
73.11%
1 gen 1995 anni
5.782
-0.784
-11.94%
1 gen 1996 anni
11.9
+6.118
105.82%
1 gen 1997 anni
9.856
-2.044
-17.18%
1 gen 1998 anni
53.741
+43.885
445.28%
1 gen 1999 anni
15.134
-38.606
-71.84%
1 gen 2000 anni
12.615
-2.52
-16.65%
1 gen 2001 anni
11.611
-1.003
-7.95%
1 gen 2002 anni
11.716
+0.105
0.9%
1 gen 2003 anni
9.495
-2.221
-18.96%
1 gen 2004 anni
15.537
+6.041
63.63%
1 gen 2005 anni
0.245
-15.291
-98.42%
1 gen 2006 anni
1.103
+0.857
349.15%
1 gen 2007 anni
0.983
-0.12
-10.87%
1 gen 2008 anni
0.883
-0.099
-10.11%
1 gen 2009 anni
0.858
-0.026
-2.9%
1 gen 2010 anni
1.298
+0.44
51.29%
1 gen 2011 anni
0.828
-0.469
-36.17%
1 gen 2012 anni
0.824
-0.004
-0.5%
1 gen 2013 anni
0.59
-0.234
-28.38%
1 gen 2014 anni
0.538
-0.052
-8.83%
1 gen 2015 anni
0.498
-0.04
-7.46%
1 gen 2016 anni
0.682
+0.184
36.9%
Classificazione dei paesi secondo i statistiche attuali per anni


Commenti: