29
/it/
it
AIzaSyAYiBZKx7MnpbEhh9jyipgxe19OcubqV5w
April 1, 2024
43014
Latin America & Caribbean (excluding high income)
LAC
false
2
1
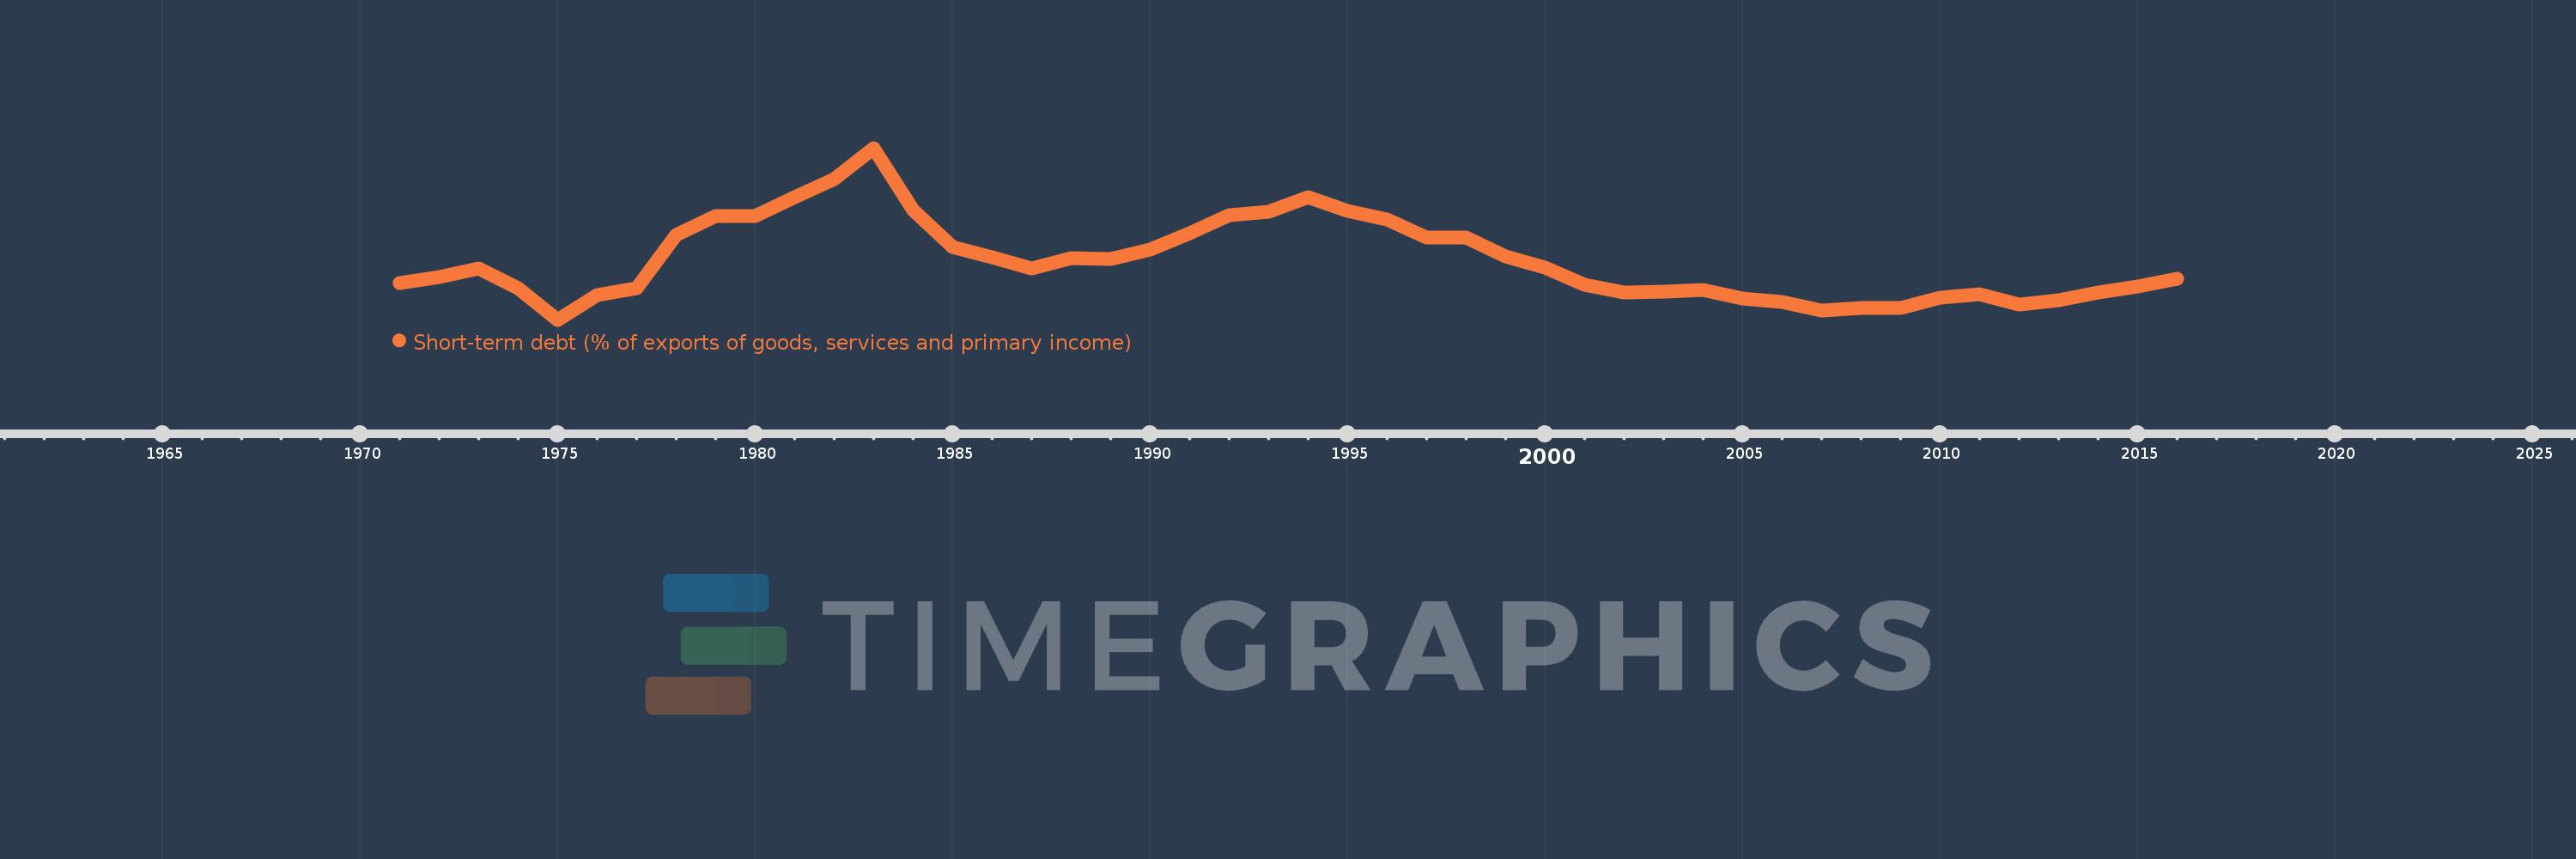
Short-term debt (% of exports of goods, services and primary income)
2016,2015,2014,2013,2012,2011,2010,2009,2008,2007,2006,2005,2004,2003,2002,2001,2000,1999,1998,1997,1996,1995,1994,1993,1992,1991,1990,1989,1988,1987,1986,1985,1984,1983,1982,1981,1980,1979,1978,1977,1976,1975,1974,1973,1972,1971
Queste statistiche in altri paesi:
Linea del tempo:
Questa scala temporale mostra un grafico dal 1971 anno al 2016 anno. Latin America & Caribbean (excluding high income). I dati fino ad 1970 anno non disponibili. Il numero di osservazioni attuali secondo i date: 46.
La fonte (nome):
Indicatori dello sviluppo mondiale
La fonte (organizzazione):
World Bank, International Debt Statistics.
Categorie:
Economy & Growth, External Debt
sono stati aggiornati
23 apr 2017 anni
Indicatori delle variazioni dei valori per anni
Minima:
12.108
1 gen 1975 anni
Massimo:
77.201
1 gen 1983 anni
Alla data di osservazione
Valore
Variazione assoluta
La variazione rispetto al valore precedente
1 gen 1971 anni
26.036
+26.036
0.0%
1 gen 1972 anni
28.37
+2.334
8.96%
1 gen 1973 anni
31.59
+3.22
11.35%
1 gen 1974 anni
24.102
-7.488
-23.7%
1 gen 1975 anni
12.108
-11.994
-49.76%
1 gen 1976 anni
21.436
+9.328
77.04%
1 gen 1977 anni
24.146
+2.71
12.64%
1 gen 1978 anni
44.371
+20.224
83.76%
1 gen 1979 anni
51.46
+7.089
15.98%
1 gen 1980 anni
51.437
-0.023
-0.04%
1 gen 1981 anni
58.63
+7.193
13.98%
1 gen 1982 anni
65.311
+6.68
11.39%
1 gen 1983 anni
77.201
+11.89
18.21%
1 gen 1984 anni
53.78
-23.421
-30.34%
1 gen 1985 anni
39.685
-14.095
-26.21%
1 gen 1986 anni
35.88
-3.805
-9.59%
1 gen 1987 anni
31.542
-4.338
-12.09%
1 gen 1988 anni
35.549
+4.007
12.7%
1 gen 1989 anni
35.251
-0.298
-0.84%
1 gen 1990 anni
38.736
+3.485
9.89%
1 gen 1991 anni
44.724
+5.987
15.46%
1 gen 1992 anni
51.801
+7.077
15.82%
1 gen 1993 anni
53.079
+1.278
2.47%
1 gen 1994 anni
58.571
+5.492
10.35%
1 gen 1995 anni
53.297
-5.274
-9.0%
1 gen 1996 anni
50.053
-3.244
-6.09%
1 gen 1997 anni
43.154
-6.899
-13.78%
1 gen 1998 anni
43.348
+0.195
0.45%
1 gen 1999 anni
36.142
-7.207
-16.63%
1 gen 2000 anni
31.845
-4.297
-11.89%
1 gen 2001 anni
25.2
-6.645
-20.87%
1 gen 2002 anni
22.476
-2.725
-10.81%
1 gen 2003 anni
22.607
+0.132
0.59%
1 gen 2004 anni
23.366
+0.759
3.36%
1 gen 2005 anni
20.227
-3.139
-13.43%
1 gen 2006 anni
18.86
-1.367
-6.76%
1 gen 2007 anni
15.467
-3.393
-17.99%
1 gen 2008 anni
16.444
+0.977
6.31%
1 gen 2009 anni
16.62
+0.176
1.07%
1 gen 2010 anni
20.398
+3.778
22.73%
1 gen 2011 anni
21.77
+1.372
6.72%
1 gen 2012 anni
17.923
-3.846
-17.67%
1 gen 2013 anni
19.487
+1.564
8.73%
1 gen 2014 anni
22.386
+2.899
14.88%
1 gen 2015 anni
24.718
+2.332
10.42%
1 gen 2016 anni
27.617
+2.899
11.73%
Classificazione dei paesi secondo i statistiche attuali per anni


Commenti: