29
/it/
it
AIzaSyAYiBZKx7MnpbEhh9jyipgxe19OcubqV5w
April 1, 2024
32208
Europe & Central Asia (excluding high income)
ECA
false
2
1
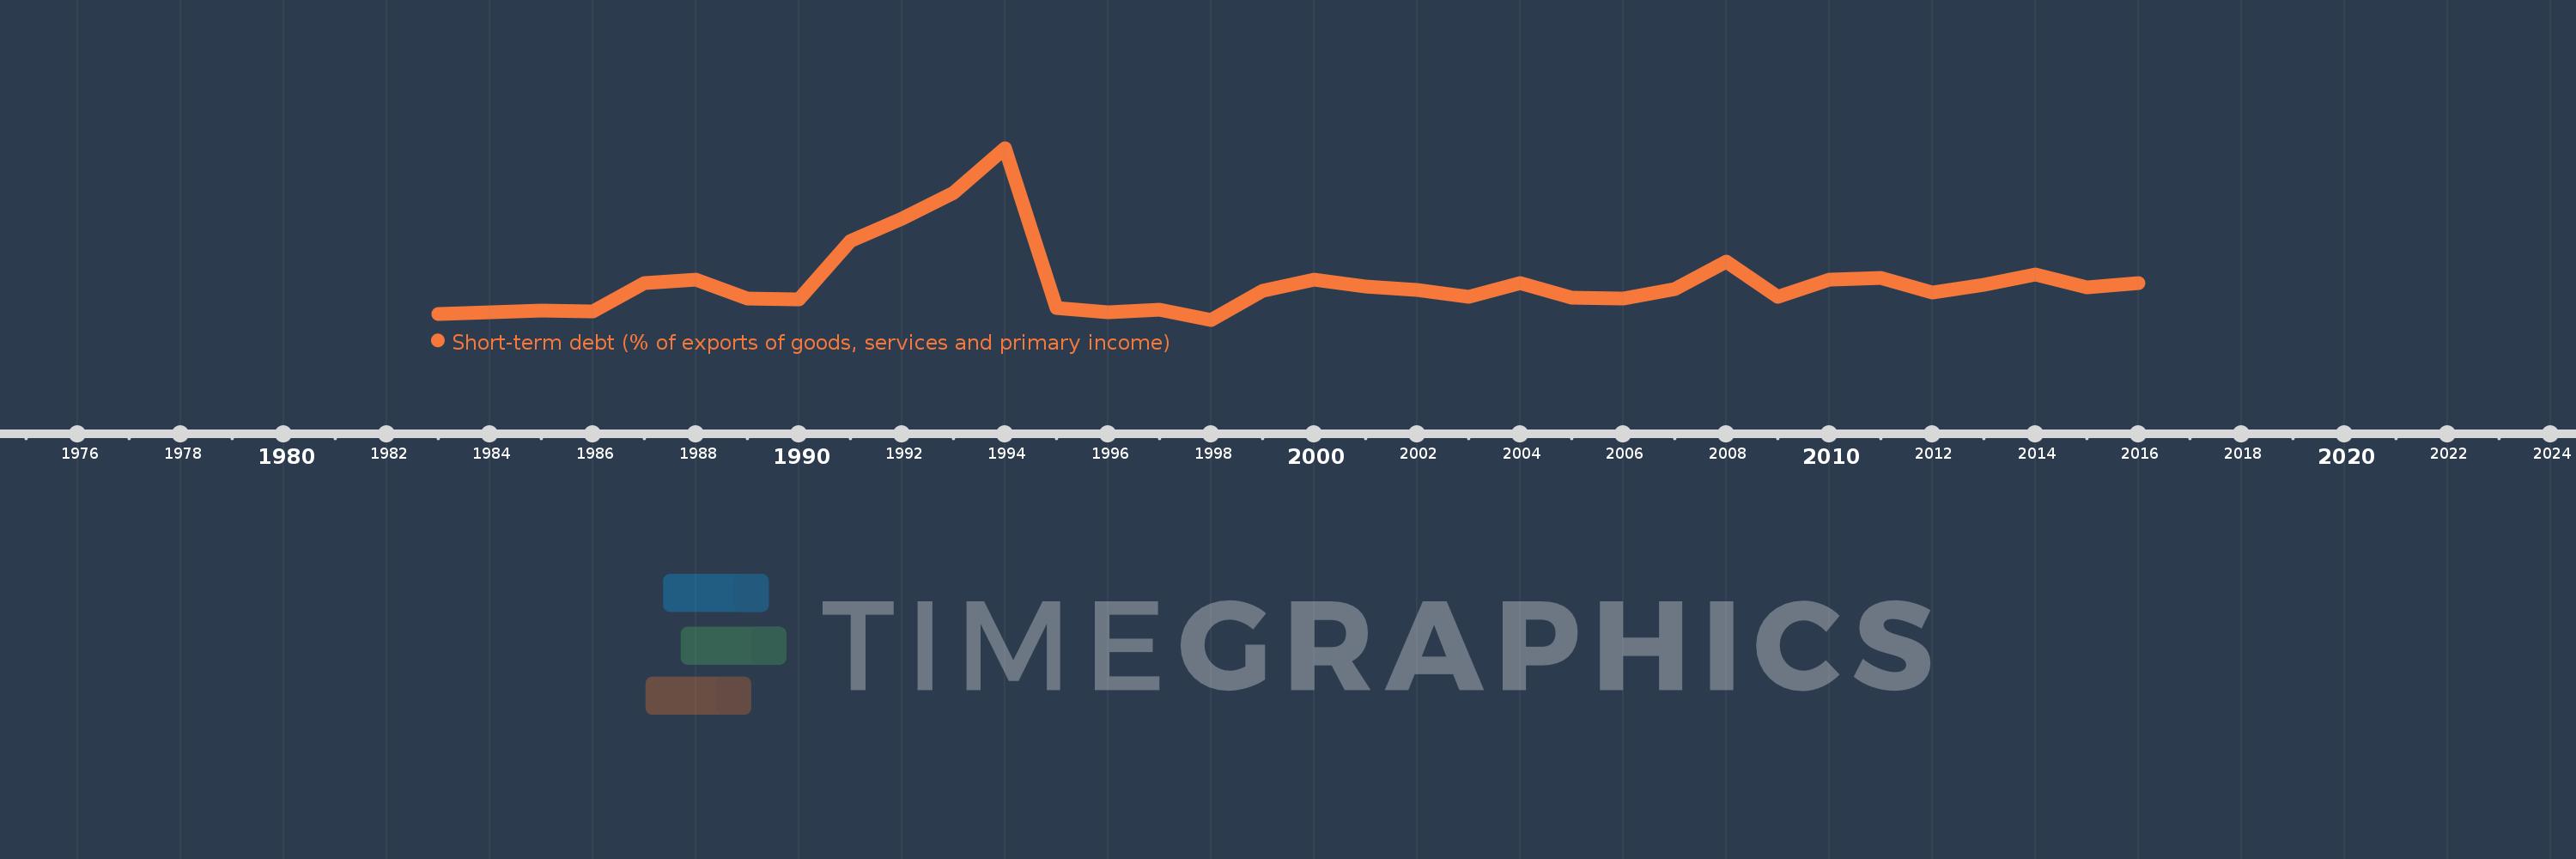
Short-term debt (% of exports of goods, services and primary income)
2016,2015,2014,2013,2012,2011,2010,2009,2008,2007,2006,2005,2004,2003,2002,2001,2000,1999,1998,1997,1996,1995,1994,1993,1992,1991,1990,1989,1988,1987,1986,1985,1983
Queste statistiche in altri paesi:
Linea del tempo:
Questa scala temporale mostra un grafico dal 1983 anno al 2016 anno. Europe & Central Asia (excluding high income). I dati fino ad 1982 anno non disponibili. Il numero di osservazioni attuali secondo i date: 33.
La fonte (nome):
Indicatori dello sviluppo mondiale
La fonte (organizzazione):
World Bank, International Debt Statistics.
Categorie:
Economy & Growth, External Debt
sono stati aggiornati
23 apr 2017 anni
Indicatori delle variazioni dei valori per anni
Minima:
13.902
1 gen 1998 anni
Massimo:
53.911
1 gen 1994 anni
Alla data di osservazione
Valore
Variazione assoluta
La variazione rispetto al valore precedente
1 gen 1983 anni
15.246
+15.246
0.0%
1 gen 1985 anni
16.058
+0.812
5.33%
1 gen 1986 anni
15.754
-0.304
-1.89%
1 gen 1987 anni
22.345
+6.592
41.84%
1 gen 1988 anni
23.219
+0.874
3.91%
1 gen 1989 anni
18.929
-4.29
-18.48%
1 gen 1990 anni
18.718
-0.211
-1.11%
1 gen 1991 anni
32.221
+13.503
72.14%
1 gen 1992 anni
37.453
+5.232
16.24%
1 gen 1993 anni
43.522
+6.069
16.2%
1 gen 1994 anni
53.911
+10.39
23.87%
1 gen 1995 anni
16.682
-37.229
-69.06%
1 gen 1996 anni
15.742
-0.94
-5.63%
1 gen 1997 anni
16.275
+0.533
3.38%
1 gen 1998 anni
13.902
-2.373
-14.58%
1 gen 1999 anni
20.634
+6.732
48.42%
1 gen 2000 anni
23.278
+2.643
12.81%
1 gen 2001 anni
21.596
-1.682
-7.23%
1 gen 2002 anni
20.808
-0.787
-3.65%
1 gen 2003 anni
19.153
-1.656
-7.96%
1 gen 2004 anni
22.365
+3.212
16.77%
1 gen 2005 anni
19.07
-3.295
-14.73%
1 gen 2006 anni
18.794
-0.276
-1.45%
1 gen 2007 anni
20.978
+2.184
11.62%
1 gen 2008 anni
27.375
+6.397
30.49%
1 gen 2009 anni
19.249
-8.126
-29.68%
1 gen 2010 anni
23.267
+4.018
20.87%
1 gen 2011 anni
23.733
+0.466
2.0%
1 gen 2012 anni
20.293
-3.44
-14.5%
1 gen 2013 anni
21.96
+1.667
8.22%
1 gen 2014 anni
24.442
+2.481
11.3%
1 gen 2015 anni
21.502
-2.94
-12.03%
1 gen 2016 anni
22.528
+1.026
4.77%
Classificazione dei paesi secondo i statistiche attuali per anni


Commenti: