29
/it/
it
AIzaSyAYiBZKx7MnpbEhh9jyipgxe19OcubqV5w
April 1, 2024
141131
Ghana
GHA
true
2
1
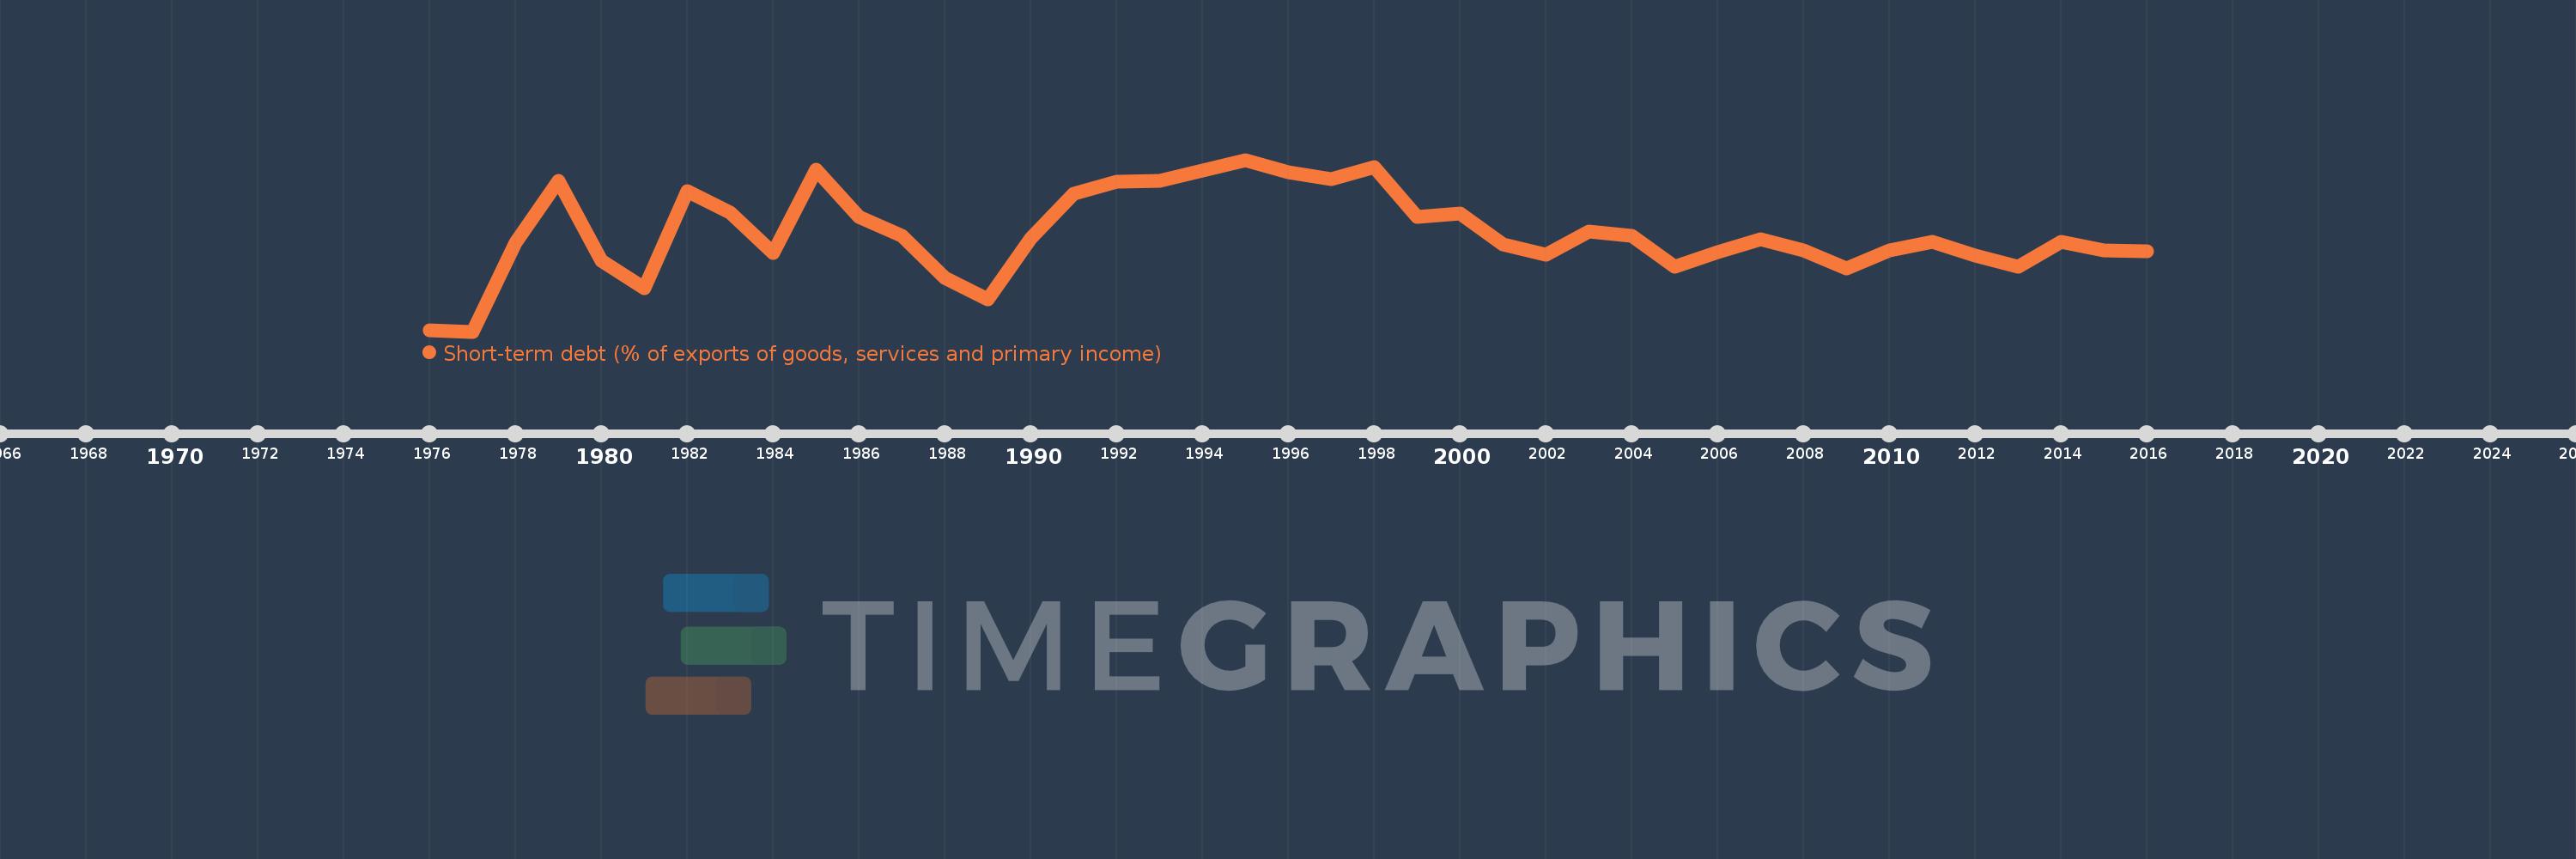
Short-term debt (% of exports of goods, services and primary income)
2016,2015,2014,2013,2012,2011,2010,2009,2008,2007,2006,2005,2004,2003,2002,2001,2000,1999,1998,1997,1996,1995,1994,1993,1992,1991,1990,1989,1988,1987,1986,1985,1984,1983,1982,1981,1980,1979,1978,1977,1976
Queste statistiche in altri paesi:
Linea del tempo:
Questa scala temporale mostra un grafico dal 1976 anno al 2016 anno. Ghana. I dati fino ad 1975 anno non disponibili. Il numero di osservazioni attuali secondo i date: 41.
La fonte (nome):
Indicatori dello sviluppo mondiale
La fonte (organizzazione):
World Bank, International Debt Statistics.
Categorie:
Economy & Growth, External Debt
sono stati aggiornati
23 apr 2017 anni
Indicatori delle variazioni dei valori per anni
Minima:
0.344
1 gen 1977 anni
Massimo:
41.962
1 gen 1995 anni
Alla data di osservazione
Valore
Variazione assoluta
La variazione rispetto al valore precedente
1 gen 1976 anni
0.649
+0.649
0.0%
1 gen 1977 anni
0.344
-0.306
-47.06%
1 gen 1978 anni
21.981
+21.637
6.29 Mille.%
1 gen 1979 anni
36.774
+14.794
67.3%
1 gen 1980 anni
17.494
-19.28
-52.43%
1 gen 1981 anni
10.781
-6.714
-38.38%
1 gen 1982 anni
34.408
+23.628
219.17%
1 gen 1983 anni
29.115
-5.293
-15.38%
1 gen 1984 anni
19.433
-9.682
-33.25%
1 gen 1985 anni
39.672
+20.239
104.14%
1 gen 1986 anni
28.159
-11.513
-29.02%
1 gen 1987 anni
23.489
-4.669
-16.58%
1 gen 1988 anni
13.416
-10.073
-42.88%
1 gen 1989 anni
8.158
-5.258
-39.19%
1 gen 1990 anni
22.899
+14.741
180.69%
1 gen 1991 anni
33.733
+10.834
47.31%
1 gen 1992 anni
36.724
+2.991
8.87%
1 gen 1993 anni
36.824
+0.099
0.27%
1 gen 1994 anni
39.412
+2.588
7.03%
1 gen 1995 anni
41.962
+2.55
6.47%
1 gen 1996 anni
38.936
-3.026
-7.21%
1 gen 1997 anni
37.348
-1.588
-4.08%
1 gen 1998 anni
40.286
+2.939
7.87%
1 gen 1999 anni
28.201
-12.085
-30.0%
1 gen 2000 anni
28.86
+0.659
2.34%
1 gen 2001 anni
21.566
-7.294
-25.27%
1 gen 2002 anni
18.994
-2.572
-11.93%
1 gen 2003 anni
24.643
+5.649
29.74%
1 gen 2004 anni
23.56
-1.084
-4.4%
1 gen 2005 anni
15.953
-7.607
-32.29%
1 gen 2006 anni
19.53
+3.578
22.43%
1 gen 2007 anni
22.8
+3.27
16.74%
1 gen 2008 anni
20.029
-2.771
-12.15%
1 gen 2009 anni
15.742
-4.287
-21.4%
1 gen 2010 anni
19.949
+4.208
26.73%
1 gen 2011 anni
22.04
+2.09
10.48%
1 gen 2012 anni
18.834
-3.206
-14.54%
1 gen 2013 anni
16.026
-2.808
-14.91%
1 gen 2014 anni
22.138
+6.112
38.14%
1 gen 2015 anni
20.05
-2.087
-9.43%
1 gen 2016 anni
19.799
-0.251
-1.25%
Classificazione dei paesi secondo i statistiche attuali per anni


Commenti: