29
/it/
it
AIzaSyAYiBZKx7MnpbEhh9jyipgxe19OcubqV5w
April 1, 2024
82401
Belize
BLZ
true
2
1
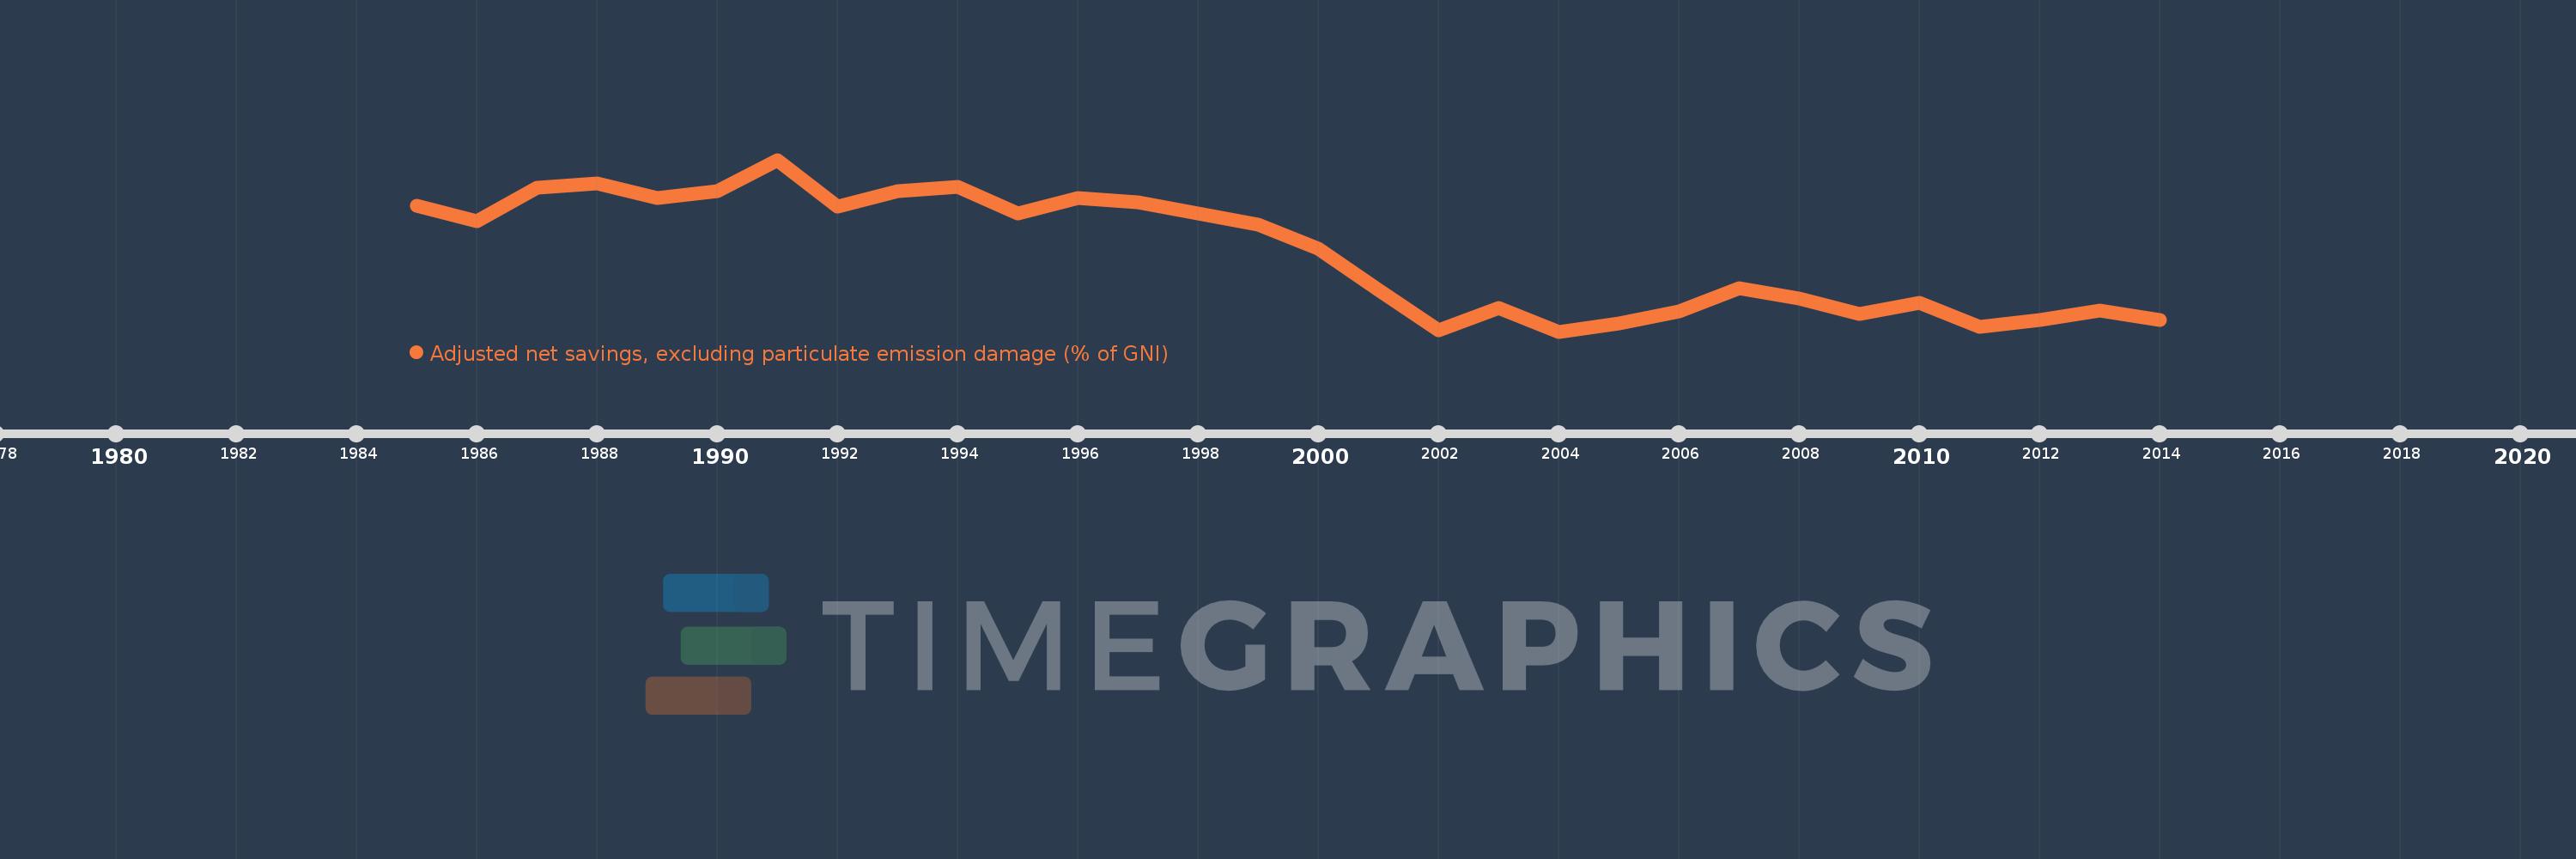
Adjusted net savings, excluding particulate emission damage (% of GNI)
2014,2013,2012,2011,2010,2009,2008,2007,2006,2005,2004,2003,2002,2001,2000,1999,1998,1997,1996,1995,1994,1993,1992,1991,1990,1989,1988,1987,1986,1985
Queste statistiche in altri paesi:
AfghanistanAlbaniaAlgeriaAngolaArab WorldArgentinaArmeniaAustraliaAustriaAzerbaijanBahamas, TheBahrainBangladeshBarbadosBelarusBelgiumBelizeBeninBhutanBoliviaBotswanaBrazilBrunei DarussalamBulgariaBurkina FasoBurundiCabo VerdeCambodiaCameroonCanadaCaribbean small statesCentral African RepublicCentral Europe and the BalticsChadChileChinaColombiaComorosCongo, Dem. Rep.Congo, Rep.Costa RicaCote d'IvoireCroatiaCyprusCzech RepublicDenmarkDjiboutiDominicaDominican RepublicEarly-demographic dividendEast Asia & PacificEast Asia & Pacific (excluding high income)East Asia & Pacific (IDA & IBRD countries)EcuadorEgypt, Arab Rep.El SalvadorEquatorial GuineaEritreaEstoniaEthiopiaEuro areaEurope & Central AsiaEurope & Central Asia (excluding high income)Europe & Central Asia (IDA & IBRD countries)European UnionFijiFinlandFragile and conflict affected situationsFranceGabonGambia, TheGeorgiaGermanyGhanaGreeceGuatemalaGuineaGuinea-BissauGuyanaHaitiHeavily indebted poor countries (HIPC)High incomeHondurasHungaryIBRD onlyIcelandIDA & IBRD totalIDA blendIDA onlyIDA totalIndiaIndonesiaIran, Islamic Rep.IraqIrelandIsraelItalyJamaicaJapanJordanKazakhstanKenyaKiribatiKorea, Rep.KuwaitKyrgyz RepublicLao PDRLate-demographic dividendLatin America & Caribbean Latin America & Caribbean (excluding high income)Latin America & the Caribbean (IDA & IBRD countries)LatviaLeast developed countries: UN classificationLebanonLesothoLiberiaLibyaLithuaniaLow & middle incomeLow incomeLower middle incomeLuxembourgMacedonia, FYRMadagascarMalawiMalaysiaMaldivesMaliMauritaniaMauritiusMexicoMiddle East & North AfricaMiddle East & North Africa (excluding high income)Middle East & North Africa (IDA & IBRD countries)Middle incomeMoldovaMongoliaMoroccoMozambiqueNamibiaNepalNetherlandsNew ZealandNicaraguaNigerNigeriaNorth AmericaNorwayOECD membersOmanOther small statesPacific island small statesPakistanPanamaPapua New GuineaParaguayPeruPhilippinesPolandPortugalPost-demographic dividendPre-demographic dividendQatarRomaniaRussian FederationRwandaSaudi ArabiaSenegalSeychellesSierra LeoneSingaporeSlovak RepublicSloveniaSmall statesSolomon IslandsSouth AfricaSouth AsiaSouth Asia (IDA & IBRD)SpainSri LankaSt. LuciaSt. Vincent and the GrenadinesSub-Saharan Africa Sub-Saharan Africa (excluding high income)Sub-Saharan Africa (IDA & IBRD countries)SudanSurinameSwazilandSwedenSwitzerlandSyrian Arab RepublicTajikistanTanzaniaThailandTogoTongaTrinidad and TobagoTunisiaTurkeyUgandaUkraineUnited KingdomUnited StatesUpper middle incomeUruguayVanuatuVenezuela, RBVietnamWorldYemen, Rep.ZambiaZimbabwe Linea del tempo:
Questa scala temporale mostra un grafico dal 1985 anno al 2014 anno. Belize. I dati fino ad 1984 anno non disponibili. Il numero di osservazioni attuali secondo i date: 30.
La fonte (nome):
Indicatori dello sviluppo mondiale
La fonte (organizzazione):
World Bank staff estimates based on sources and methods in World Bank's "The Changing Wealth of Nations: Measuring Sustainable Development in the New Millennium" (2011).
Categorie:
Economy & Growth, Environment
sono stati aggiornati
23 apr 2017 anni
Indicatori delle variazioni dei valori per anni
Minima:
-8.118
1 gen 2004 anni
Massimo:
31.773
1 gen 1991 anni
Alla data di osservazione
Valore
Variazione assoluta
La variazione rispetto al valore precedente
1 gen 1985 anni
21.125
+21.125
0.0%
1 gen 1986 anni
17.448
-3.677
-17.41%
1 gen 1987 anni
25.195
+7.747
44.4%
1 gen 1988 anni
26.248
+1.052
4.18%
1 gen 1989 anni
22.822
-3.425
-13.05%
1 gen 1990 anni
24.407
+1.585
6.95%
1 gen 1991 anni
31.773
+7.365
30.18%
1 gen 1992 anni
20.884
-10.889
-34.27%
1 gen 1993 anni
24.423
+3.539
16.95%
1 gen 1994 anni
25.444
+1.021
4.18%
1 gen 1995 anni
19.399
-6.045
-23.76%
1 gen 1996 anni
22.96
+3.562
18.36%
1 gen 1997 anni
21.813
-1.147
-5.0%
1 gen 1998 anni
19.328
-2.485
-11.39%
1 gen 1999 anni
16.622
-2.705
-14.0%
1 gen 2000 anni
11.171
-5.451
-32.8%
1 gen 2001 anni
1.473
-9.698
-86.82%
1 gen 2002 anni
-7.749
-9.222
-626.26%
1 gen 2003 anni
-2.674
+5.076
-65.5%
1 gen 2004 anni
-8.118
-5.445
203.63%
1 gen 2005 anni
-6.128
+1.99
-24.52%
1 gen 2006 anni
-3.395
+2.733
-44.59%
1 gen 2007 anni
1.908
+5.304
-156.21%
1 gen 2008 anni
-0.425
-2.334
-122.29%
1 gen 2009 anni
-4.026
-3.6
846.32%
1 gen 2010 anni
-1.453
+2.573
-63.92%
1 gen 2011 anni
-6.96
-5.507
379.12%
1 gen 2012 anni
-5.345
+1.614
-23.2%
1 gen 2013 anni
-3.317
+2.028
-37.94%
1 gen 2014 anni
-5.421
-2.104
63.43%
Classificazione dei paesi secondo i statistiche attuali per anni


Commenti: