29
/it/
it
AIzaSyAYiBZKx7MnpbEhh9jyipgxe19OcubqV5w
April 1, 2024
60520
Sub-Saharan Africa (IDA & IBRD countries)
TSS
false
2
1
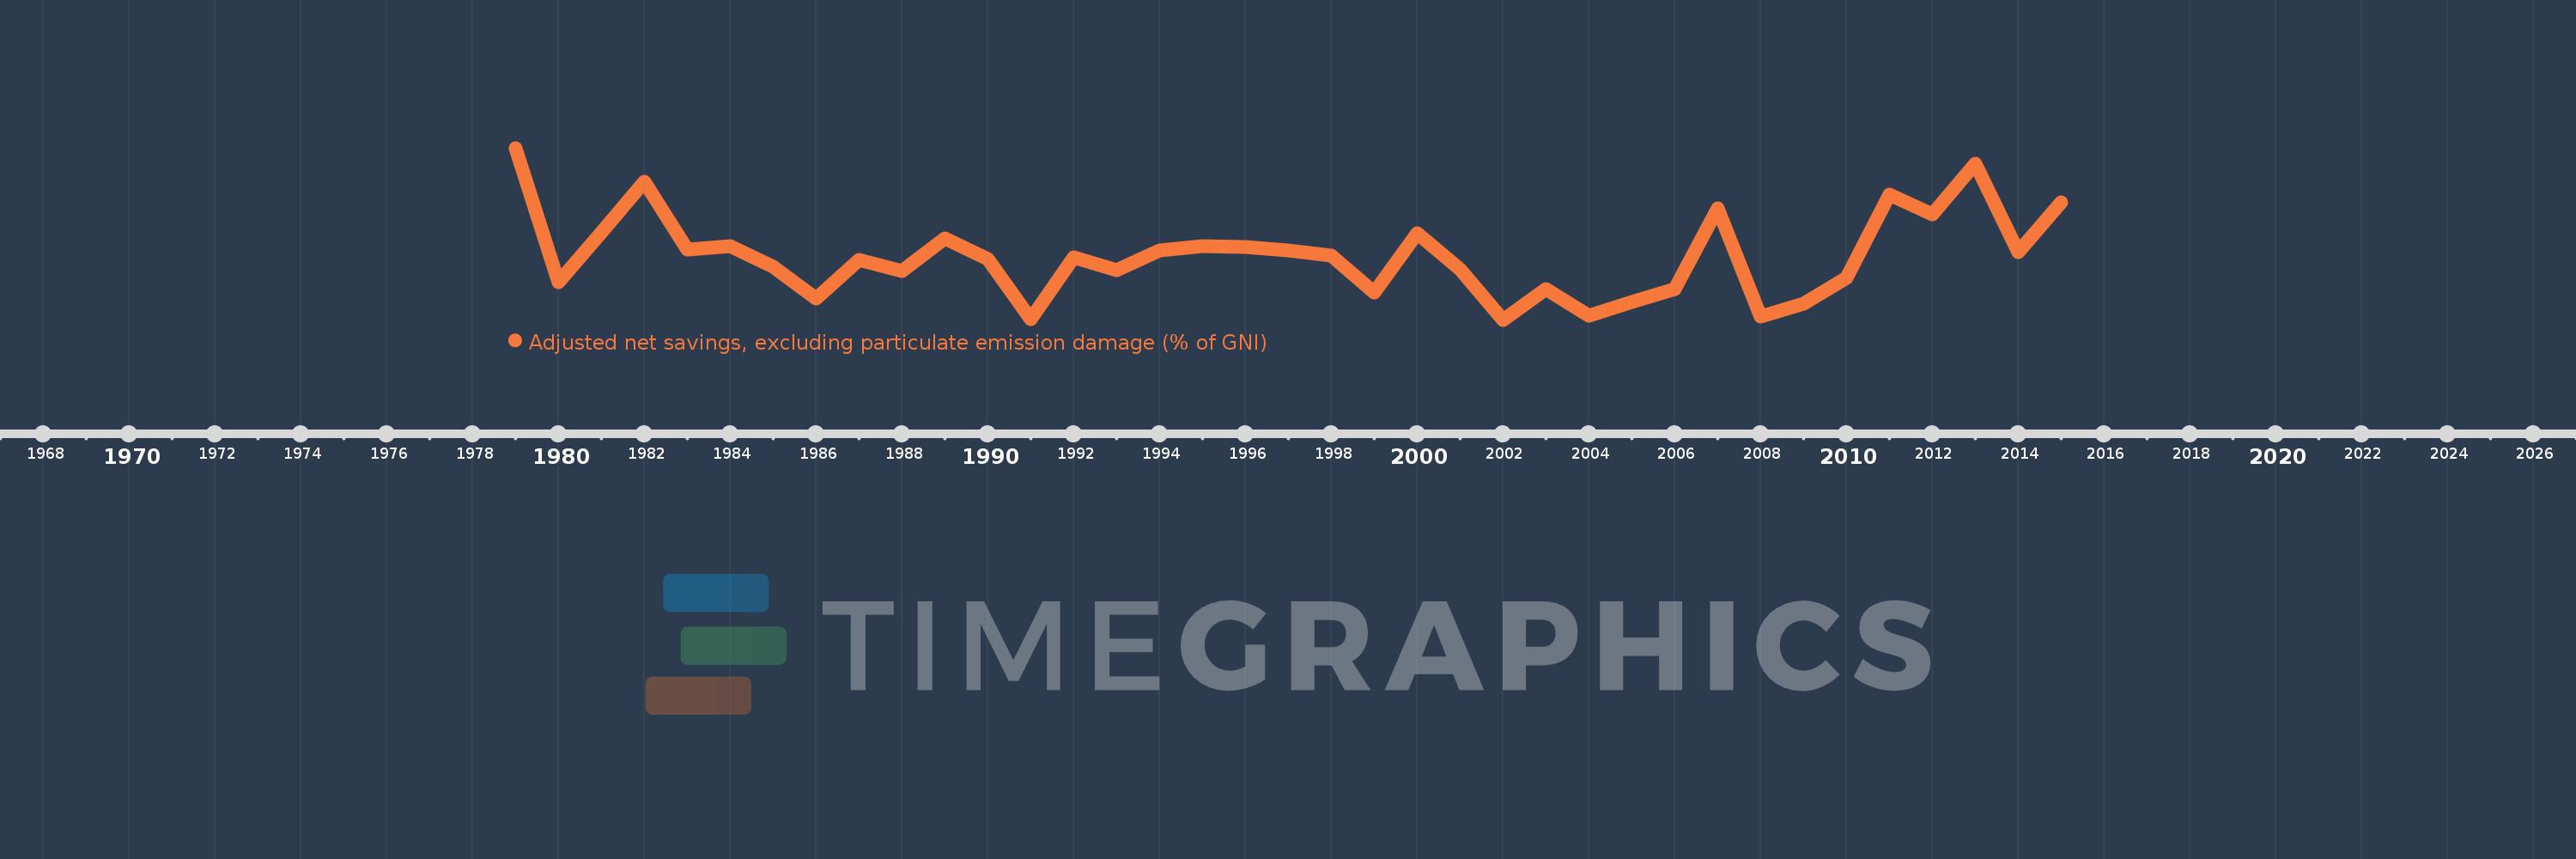
Adjusted net savings, excluding particulate emission damage (% of GNI)
2015,2014,2013,2012,2011,2010,2009,2008,2007,2006,2005,2004,2003,2002,2001,2000,1999,1998,1997,1996,1995,1994,1993,1992,1991,1990,1989,1988,1987,1986,1985,1984,1983,1982,1981,1980,1979
Queste statistiche in altri paesi:
AfghanistanAlbaniaAlgeriaAngolaArab WorldArgentinaArmeniaAustraliaAustriaAzerbaijanBahamas, TheBahrainBangladeshBarbadosBelarusBelgiumBelizeBeninBhutanBoliviaBotswanaBrazilBrunei DarussalamBulgariaBurkina FasoBurundiCabo VerdeCambodiaCameroonCanadaCaribbean small statesCentral African RepublicCentral Europe and the BalticsChadChileChinaColombiaComorosCongo, Dem. Rep.Congo, Rep.Costa RicaCote d'IvoireCroatiaCyprusCzech RepublicDenmarkDjiboutiDominicaDominican RepublicEarly-demographic dividendEast Asia & PacificEast Asia & Pacific (excluding high income)East Asia & Pacific (IDA & IBRD countries)EcuadorEgypt, Arab Rep.El SalvadorEquatorial GuineaEritreaEstoniaEthiopiaEuro areaEurope & Central AsiaEurope & Central Asia (excluding high income)Europe & Central Asia (IDA & IBRD countries)European UnionFijiFinlandFragile and conflict affected situationsFranceGabonGambia, TheGeorgiaGermanyGhanaGreeceGuatemalaGuineaGuinea-BissauGuyanaHaitiHeavily indebted poor countries (HIPC)High incomeHondurasHungaryIBRD onlyIcelandIDA & IBRD totalIDA blendIDA onlyIDA totalIndiaIndonesiaIran, Islamic Rep.IraqIrelandIsraelItalyJamaicaJapanJordanKazakhstanKenyaKiribatiKorea, Rep.KuwaitKyrgyz RepublicLao PDRLate-demographic dividendLatin America & Caribbean Latin America & Caribbean (excluding high income)Latin America & the Caribbean (IDA & IBRD countries)LatviaLeast developed countries: UN classificationLebanonLesothoLiberiaLibyaLithuaniaLow & middle incomeLow incomeLower middle incomeLuxembourgMacedonia, FYRMadagascarMalawiMalaysiaMaldivesMaliMauritaniaMauritiusMexicoMiddle East & North AfricaMiddle East & North Africa (excluding high income)Middle East & North Africa (IDA & IBRD countries)Middle incomeMoldovaMongoliaMoroccoMozambiqueNamibiaNepalNetherlandsNew ZealandNicaraguaNigerNigeriaNorth AmericaNorwayOECD membersOmanOther small statesPacific island small statesPakistanPanamaPapua New GuineaParaguayPeruPhilippinesPolandPortugalPost-demographic dividendPre-demographic dividendQatarRomaniaRussian FederationRwandaSaudi ArabiaSenegalSeychellesSierra LeoneSingaporeSlovak RepublicSloveniaSmall statesSolomon IslandsSouth AfricaSouth AsiaSouth Asia (IDA & IBRD)SpainSri LankaSt. LuciaSt. Vincent and the GrenadinesSub-Saharan Africa Sub-Saharan Africa (excluding high income)Sub-Saharan Africa (IDA & IBRD countries)SudanSurinameSwazilandSwedenSwitzerlandSyrian Arab RepublicTajikistanTanzaniaThailandTogoTongaTrinidad and TobagoTunisiaTurkeyUgandaUkraineUnited KingdomUnited StatesUpper middle incomeUruguayVanuatuVenezuela, RBVietnamWorldYemen, Rep.ZambiaZimbabwe Linea del tempo:
Questa scala temporale mostra un grafico dal 1979 anno al 2015 anno. Sub-Saharan Africa (IDA & IBRD countries). I dati fino ad 1978 anno non disponibili. Il numero di osservazioni attuali secondo i date: 37.
La fonte (nome):
Indicatori dello sviluppo mondiale
La fonte (organizzazione):
World Bank staff estimates based on sources and methods in World Bank's "The Changing Wealth of Nations: Measuring Sustainable Development in the New Millennium" (2011).
Categorie:
Economy & Growth, Environment
sono stati aggiornati
23 apr 2017 anni
Indicatori delle variazioni dei valori per anni
Minima:
-0.588
1 gen 2002 anni
Massimo:
9.2
1 gen 1979 anni
Alla data di osservazione
Valore
Variazione assoluta
La variazione rispetto al valore precedente
1 gen 1979 anni
9.2
+9.2
0.0%
1 gen 1980 anni
1.541
-7.659
-83.25%
1 gen 1981 anni
4.4
+2.859
185.6%
1 gen 1982 anni
7.264
+2.864
65.09%
1 gen 1983 anni
3.412
-3.852
-53.03%
1 gen 1984 anni
3.611
+0.199
5.83%
1 gen 1985 anni
2.448
-1.162
-32.19%
1 gen 1986 anni
0.606
-1.843
-75.26%
1 gen 1987 anni
2.803
+2.198
362.86%
1 gen 1988 anni
2.165
-0.638
-22.77%
1 gen 1989 anni
4.07
+1.905
87.97%
1 gen 1990 anni
2.869
-1.201
-29.51%
1 gen 1991 anni
-0.56
-3.428
-119.5%
1 gen 1992 anni
2.958
+3.518
-628.76%
1 gen 1993 anni
2.252
-0.706
-23.87%
1 gen 1994 anni
3.36
+1.108
49.2%
1 gen 1995 anni
3.615
+0.254
7.57%
1 gen 1996 anni
3.565
-0.05
-1.39%
1 gen 1997 anni
3.348
-0.216
-6.07%
1 gen 1998 anni
3.046
-0.302
-9.03%
1 gen 1999 anni
0.962
-2.084
-68.42%
1 gen 2000 anni
4.362
+3.4
353.47%
1 gen 2001 anni
2.263
-2.099
-48.13%
1 gen 2002 anni
-0.588
-2.85
-125.98%
1 gen 2003 anni
1.148
+1.736
-295.27%
1 gen 2004 anni
-0.344
-1.492
-129.96%
1 gen 2005 anni
0.428
+0.772
-224.45%
1 gen 2006 anni
1.151
+0.724
169.07%
1 gen 2007 anni
5.762
+4.611
400.42%
1 gen 2008 anni
-0.389
-6.151
-106.74%
1 gen 2009 anni
0.348
+0.737
-189.62%
1 gen 2010 anni
1.815
+1.467
421.07%
1 gen 2011 anni
6.532
+4.718
259.92%
1 gen 2012 anni
5.425
-1.108
-16.96%
1 gen 2013 anni
8.296
+2.871
52.93%
1 gen 2014 anni
3.267
-5.029
-60.62%
1 gen 2015 anni
6.086
+2.819
86.27%
Classificazione dei paesi secondo i statistiche attuali per anni


Commenti: