29
/it/
it
AIzaSyAYiBZKx7MnpbEhh9jyipgxe19OcubqV5w
April 1, 2024
108201
Comoros
COM
true
2
1
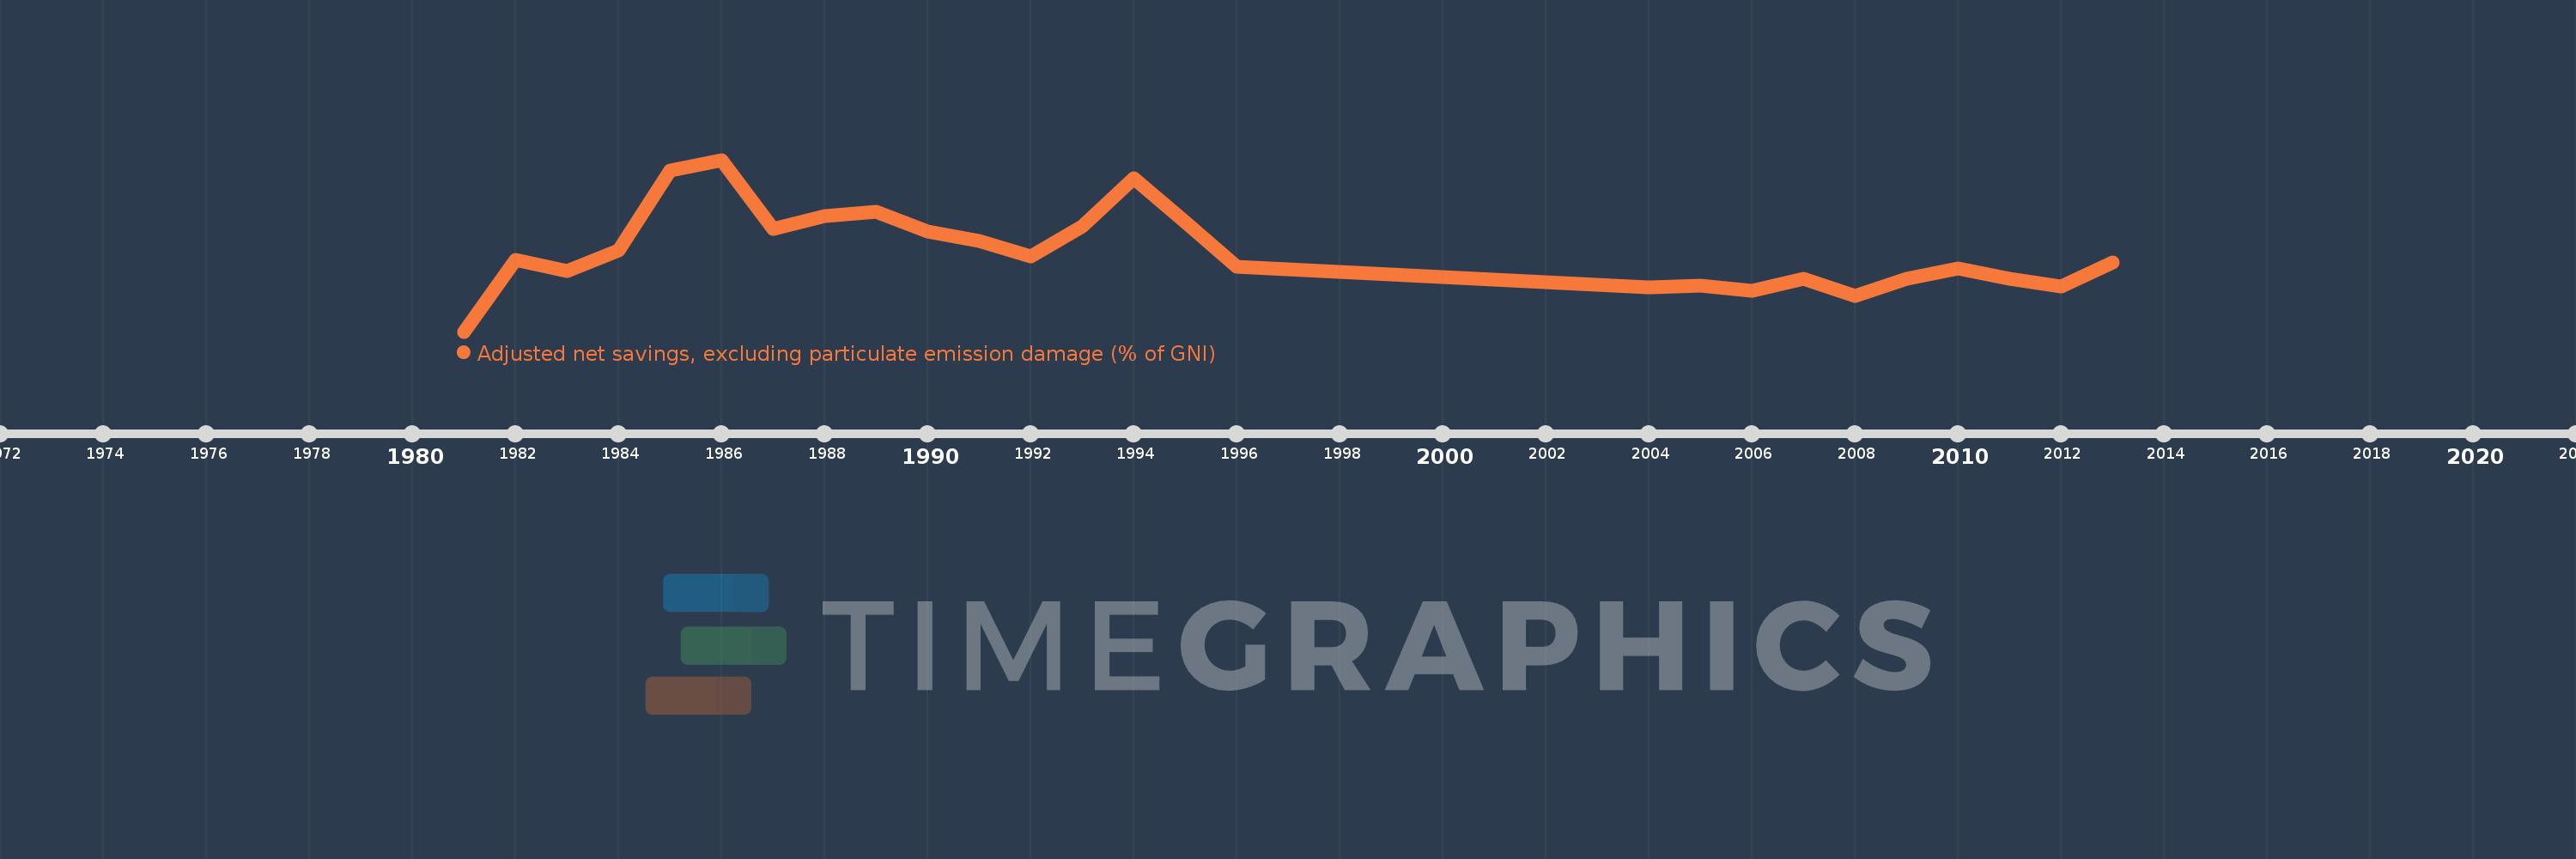
Adjusted net savings, excluding particulate emission damage (% of GNI)
2013,2012,2011,2010,2009,2008,2007,2006,2005,2004,1996,1995,1994,1993,1992,1991,1990,1989,1988,1987,1986,1985,1984,1983,1982,1981
Queste statistiche in altri paesi:
AfghanistanAlbaniaAlgeriaAngolaArab WorldArgentinaArmeniaAustraliaAustriaAzerbaijanBahamas, TheBahrainBangladeshBarbadosBelarusBelgiumBelizeBeninBhutanBoliviaBotswanaBrazilBrunei DarussalamBulgariaBurkina FasoBurundiCabo VerdeCambodiaCameroonCanadaCaribbean small statesCentral African RepublicCentral Europe and the BalticsChadChileChinaColombiaComorosCongo, Dem. Rep.Congo, Rep.Costa RicaCote d'IvoireCroatiaCyprusCzech RepublicDenmarkDjiboutiDominicaDominican RepublicEarly-demographic dividendEast Asia & PacificEast Asia & Pacific (excluding high income)East Asia & Pacific (IDA & IBRD countries)EcuadorEgypt, Arab Rep.El SalvadorEquatorial GuineaEritreaEstoniaEthiopiaEuro areaEurope & Central AsiaEurope & Central Asia (excluding high income)Europe & Central Asia (IDA & IBRD countries)European UnionFijiFinlandFragile and conflict affected situationsFranceGabonGambia, TheGeorgiaGermanyGhanaGreeceGuatemalaGuineaGuinea-BissauGuyanaHaitiHeavily indebted poor countries (HIPC)High incomeHondurasHungaryIBRD onlyIcelandIDA & IBRD totalIDA blendIDA onlyIDA totalIndiaIndonesiaIran, Islamic Rep.IraqIrelandIsraelItalyJamaicaJapanJordanKazakhstanKenyaKiribatiKorea, Rep.KuwaitKyrgyz RepublicLao PDRLate-demographic dividendLatin America & Caribbean Latin America & Caribbean (excluding high income)Latin America & the Caribbean (IDA & IBRD countries)LatviaLeast developed countries: UN classificationLebanonLesothoLiberiaLibyaLithuaniaLow & middle incomeLow incomeLower middle incomeLuxembourgMacedonia, FYRMadagascarMalawiMalaysiaMaldivesMaliMauritaniaMauritiusMexicoMiddle East & North AfricaMiddle East & North Africa (excluding high income)Middle East & North Africa (IDA & IBRD countries)Middle incomeMoldovaMongoliaMoroccoMozambiqueNamibiaNepalNetherlandsNew ZealandNicaraguaNigerNigeriaNorth AmericaNorwayOECD membersOmanOther small statesPacific island small statesPakistanPanamaPapua New GuineaParaguayPeruPhilippinesPolandPortugalPost-demographic dividendPre-demographic dividendQatarRomaniaRussian FederationRwandaSaudi ArabiaSenegalSeychellesSierra LeoneSingaporeSlovak RepublicSloveniaSmall statesSolomon IslandsSouth AfricaSouth AsiaSouth Asia (IDA & IBRD)SpainSri LankaSt. LuciaSt. Vincent and the GrenadinesSub-Saharan Africa Sub-Saharan Africa (excluding high income)Sub-Saharan Africa (IDA & IBRD countries)SudanSurinameSwazilandSwedenSwitzerlandSyrian Arab RepublicTajikistanTanzaniaThailandTogoTongaTrinidad and TobagoTunisiaTurkeyUgandaUkraineUnited KingdomUnited StatesUpper middle incomeUruguayVanuatuVenezuela, RBVietnamWorldYemen, Rep.ZambiaZimbabwe Linea del tempo:
Questa scala temporale mostra un grafico dal 1981 anno al 2013 anno. Comoros. I dati fino ad 1980 anno non disponibili. Il numero di osservazioni attuali secondo i date: 26.
La fonte (nome):
Indicatori dello sviluppo mondiale
La fonte (organizzazione):
World Bank staff estimates based on sources and methods in World Bank's "The Changing Wealth of Nations: Measuring Sustainable Development in the New Millennium" (2011).
Categorie:
Economy & Growth, Environment
sono stati aggiornati
23 apr 2017 anni
Indicatori delle variazioni dei valori per anni
Minima:
-12.205
1 gen 1981 anni
Massimo:
14.799
1 gen 1986 anni
Alla data di osservazione
Valore
Variazione assoluta
La variazione rispetto al valore precedente
1 gen 1981 anni
-12.205
-12.205
0.0%
1 gen 1982 anni
-0.895
+11.31
-92.67%
1 gen 1983 anni
-2.651
-1.756
196.25%
1 gen 1984 anni
0.602
+3.252
-122.69%
1 gen 1985 anni
13.061
+12.459
2.07 Mille.%
1 gen 1986 anni
14.799
+1.738
13.31%
1 gen 1987 anni
3.939
-10.86
-73.38%
1 gen 1988 anni
5.938
+1.998
50.73%
1 gen 1989 anni
6.666
+0.729
12.27%
1 gen 1990 anni
3.585
-3.081
-46.22%
1 gen 1991 anni
2.03
-1.555
-43.36%
1 gen 1992 anni
-0.435
-2.465
-121.42%
1 gen 1993 anni
4.346
+4.78
-1.1 Mille.%
1 gen 1994 anni
11.953
+7.608
175.06%
1 gen 1995 anni
5.027
-6.926
-57.94%
1 gen 1996 anni
-1.957
-6.985
-138.93%
1 gen 2004 anni
-5.197
-3.239
165.51%
1 gen 2005 anni
-4.971
+0.226
-4.35%
1 gen 2006 anni
-5.734
-0.764
15.36%
1 gen 2007 anni
-3.868
+1.866
-32.55%
1 gen 2008 anni
-6.573
-2.705
69.93%
1 gen 2009 anni
-3.846
+2.727
-41.49%
1 gen 2010 anni
-2.297
+1.549
-40.28%
1 gen 2011 anni
-3.958
-1.661
72.3%
1 gen 2012 anni
-5.053
-1.095
27.66%
1 gen 2013 anni
-1.387
+3.665
-72.54%
Classificazione dei paesi secondo i statistiche attuali per anni


Commenti: