29
/it/
it
AIzaSyAYiBZKx7MnpbEhh9jyipgxe19OcubqV5w
April 1, 2024
28840
East Asia & Pacific (IDA & IBRD countries)
TEA
false
2
1
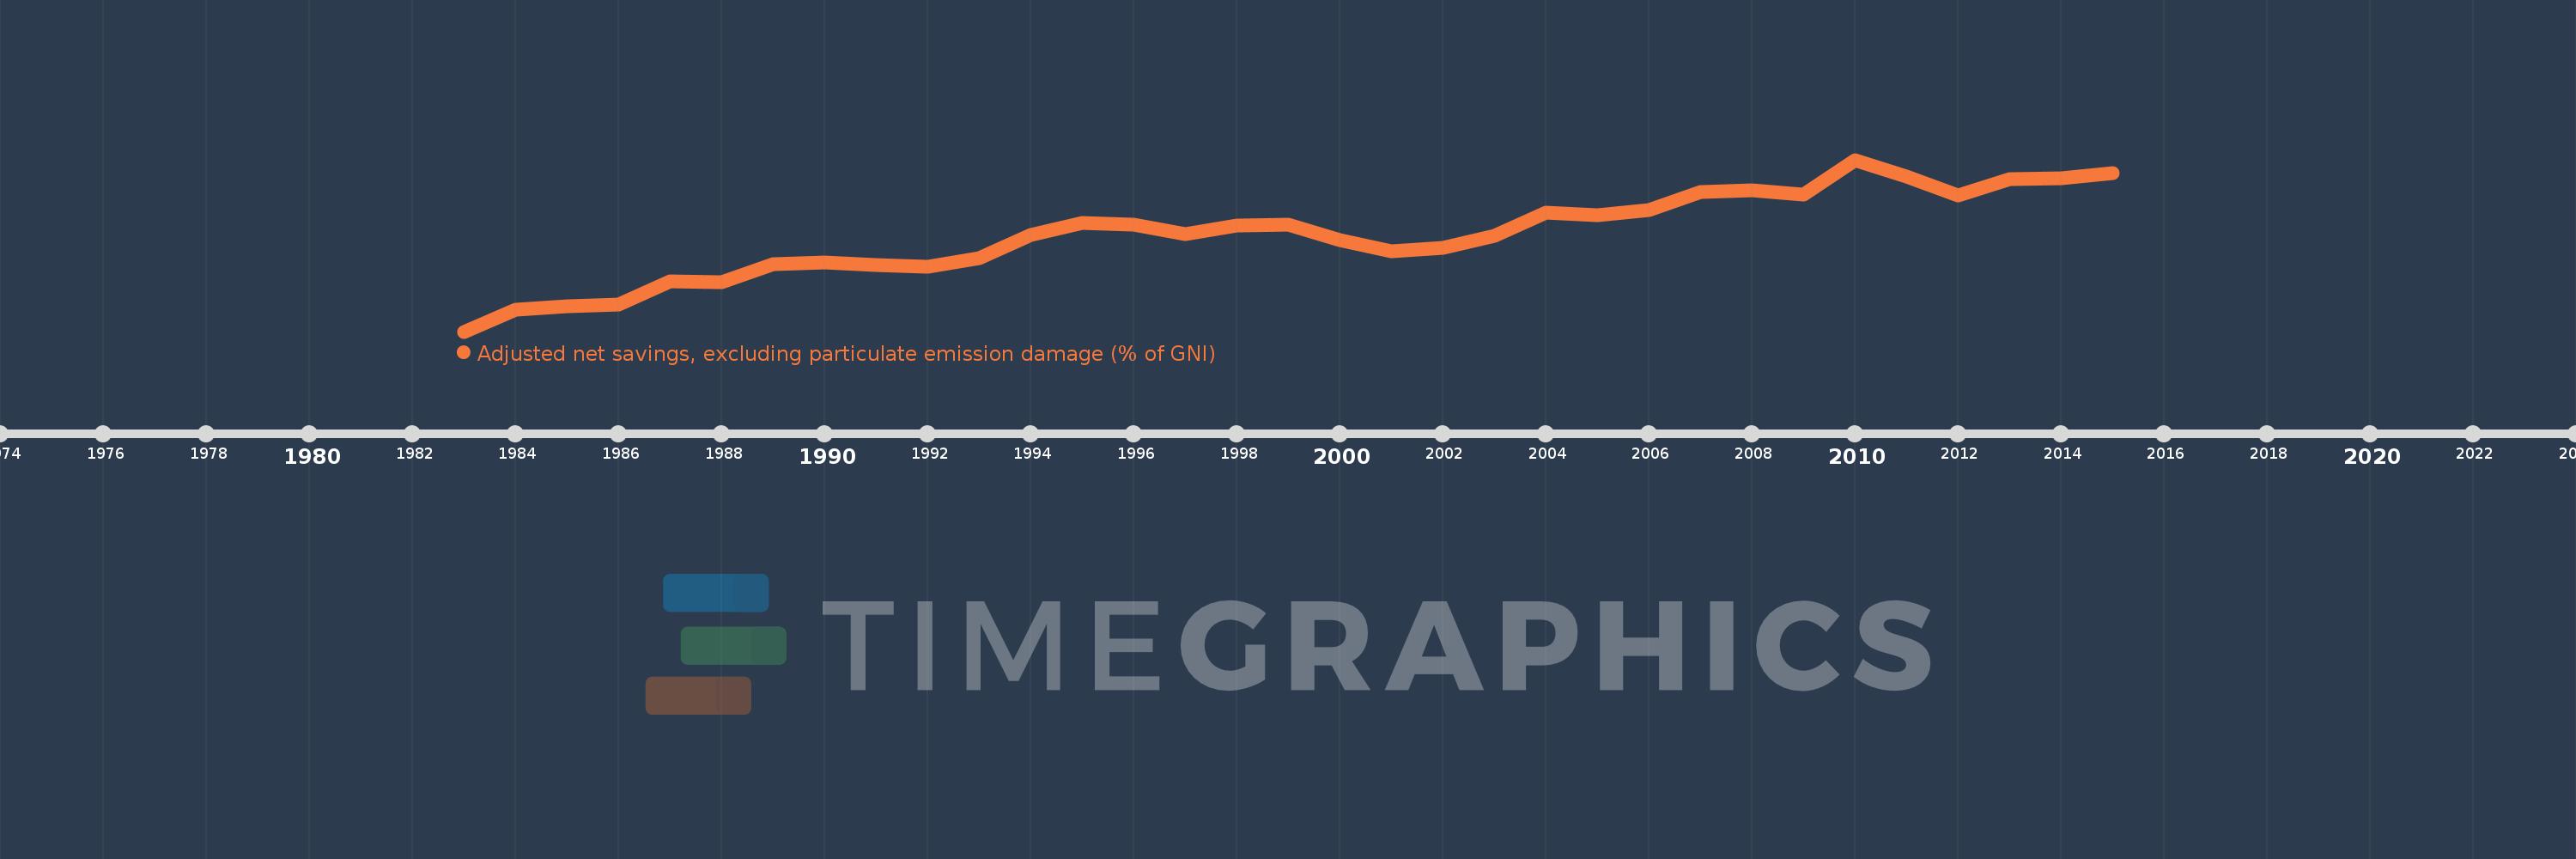
Adjusted net savings, excluding particulate emission damage (% of GNI)
2015,2014,2013,2012,2011,2010,2009,2008,2007,2006,2005,2004,2003,2002,2001,2000,1999,1998,1997,1996,1995,1994,1993,1992,1991,1990,1989,1988,1987,1986,1985,1984,1983
Queste statistiche in altri paesi:
AfghanistanAlbaniaAlgeriaAngolaArab WorldArgentinaArmeniaAustraliaAustriaAzerbaijanBahamas, TheBahrainBangladeshBarbadosBelarusBelgiumBelizeBeninBhutanBoliviaBotswanaBrazilBrunei DarussalamBulgariaBurkina FasoBurundiCabo VerdeCambodiaCameroonCanadaCaribbean small statesCentral African RepublicCentral Europe and the BalticsChadChileChinaColombiaComorosCongo, Dem. Rep.Congo, Rep.Costa RicaCote d'IvoireCroatiaCyprusCzech RepublicDenmarkDjiboutiDominicaDominican RepublicEarly-demographic dividendEast Asia & PacificEast Asia & Pacific (excluding high income)East Asia & Pacific (IDA & IBRD countries)EcuadorEgypt, Arab Rep.El SalvadorEquatorial GuineaEritreaEstoniaEthiopiaEuro areaEurope & Central AsiaEurope & Central Asia (excluding high income)Europe & Central Asia (IDA & IBRD countries)European UnionFijiFinlandFragile and conflict affected situationsFranceGabonGambia, TheGeorgiaGermanyGhanaGreeceGuatemalaGuineaGuinea-BissauGuyanaHaitiHeavily indebted poor countries (HIPC)High incomeHondurasHungaryIBRD onlyIcelandIDA & IBRD totalIDA blendIDA onlyIDA totalIndiaIndonesiaIran, Islamic Rep.IraqIrelandIsraelItalyJamaicaJapanJordanKazakhstanKenyaKiribatiKorea, Rep.KuwaitKyrgyz RepublicLao PDRLate-demographic dividendLatin America & Caribbean Latin America & Caribbean (excluding high income)Latin America & the Caribbean (IDA & IBRD countries)LatviaLeast developed countries: UN classificationLebanonLesothoLiberiaLibyaLithuaniaLow & middle incomeLow incomeLower middle incomeLuxembourgMacedonia, FYRMadagascarMalawiMalaysiaMaldivesMaliMauritaniaMauritiusMexicoMiddle East & North AfricaMiddle East & North Africa (excluding high income)Middle East & North Africa (IDA & IBRD countries)Middle incomeMoldovaMongoliaMoroccoMozambiqueNamibiaNepalNetherlandsNew ZealandNicaraguaNigerNigeriaNorth AmericaNorwayOECD membersOmanOther small statesPacific island small statesPakistanPanamaPapua New GuineaParaguayPeruPhilippinesPolandPortugalPost-demographic dividendPre-demographic dividendQatarRomaniaRussian FederationRwandaSaudi ArabiaSenegalSeychellesSierra LeoneSingaporeSlovak RepublicSloveniaSmall statesSolomon IslandsSouth AfricaSouth AsiaSouth Asia (IDA & IBRD)SpainSri LankaSt. LuciaSt. Vincent and the GrenadinesSub-Saharan Africa Sub-Saharan Africa (excluding high income)Sub-Saharan Africa (IDA & IBRD countries)SudanSurinameSwazilandSwedenSwitzerlandSyrian Arab RepublicTajikistanTanzaniaThailandTogoTongaTrinidad and TobagoTunisiaTurkeyUgandaUkraineUnited KingdomUnited StatesUpper middle incomeUruguayVanuatuVenezuela, RBVietnamWorldYemen, Rep.ZambiaZimbabwe Linea del tempo:
Questa scala temporale mostra un grafico dal 1983 anno al 2015 anno. East Asia & Pacific (IDA & IBRD countries). I dati fino ad 1982 anno non disponibili. Il numero di osservazioni attuali secondo i date: 33.
La fonte (nome):
Indicatori dello sviluppo mondiale
La fonte (organizzazione):
World Bank staff estimates based on sources and methods in World Bank's "The Changing Wealth of Nations: Measuring Sustainable Development in the New Millennium" (2011).
Categorie:
Economy & Growth, Environment
sono stati aggiornati
23 apr 2017 anni
Indicatori delle variazioni dei valori per anni
Minima:
10.067
1 gen 1983 anni
Massimo:
34.421
1 gen 2010 anni
Alla data di osservazione
Valore
Variazione assoluta
La variazione rispetto al valore precedente
1 gen 1983 anni
10.067
+10.067
0.0%
1 gen 1984 anni
13.186
+3.119
30.99%
1 gen 1985 anni
13.614
+0.428
3.25%
1 gen 1986 anni
13.929
+0.314
2.31%
1 gen 1987 anni
17.176
+3.247
23.31%
1 gen 1988 anni
17.129
-0.047
-0.27%
1 gen 1989 anni
19.569
+2.439
14.24%
1 gen 1990 anni
19.814
+0.245
1.25%
1 gen 1991 anni
19.451
-0.362
-1.83%
1 gen 1992 anni
19.316
-0.135
-0.69%
1 gen 1993 anni
20.499
+1.183
6.13%
1 gen 1994 anni
23.756
+3.256
15.88%
1 gen 1995 anni
25.478
+1.723
7.25%
1 gen 1996 anni
25.248
-0.23
-0.9%
1 gen 1997 anni
23.844
-1.405
-5.56%
1 gen 1998 anni
25.122
+1.279
5.36%
1 gen 1999 anni
25.235
+0.113
0.45%
1 gen 2000 anni
23.047
-2.188
-8.67%
1 gen 2001 anni
21.423
-1.624
-7.05%
1 gen 2002 anni
21.919
+0.496
2.32%
1 gen 2003 anni
23.688
+1.769
8.07%
1 gen 2004 anni
26.907
+3.22
13.59%
1 gen 2005 anni
26.573
-0.334
-1.24%
1 gen 2006 anni
27.293
+0.719
2.71%
1 gen 2007 anni
29.795
+2.503
9.17%
1 gen 2008 anni
30.079
+0.283
0.95%
1 gen 2009 anni
29.443
-0.635
-2.11%
1 gen 2010 anni
34.421
+4.978
16.91%
1 gen 2011 anni
32.02
-2.401
-6.98%
1 gen 2012 anni
29.421
-2.599
-8.12%
1 gen 2013 anni
31.677
+2.256
7.67%
1 gen 2014 anni
31.828
+0.152
0.48%
1 gen 2015 anni
32.573
+0.745
2.34%
Classificazione dei paesi secondo i statistiche attuali per anni


Commenti: