29
/it/
it
AIzaSyAYiBZKx7MnpbEhh9jyipgxe19OcubqV5w
April 1, 2024
225564
Portugal
PRT
true
2
1
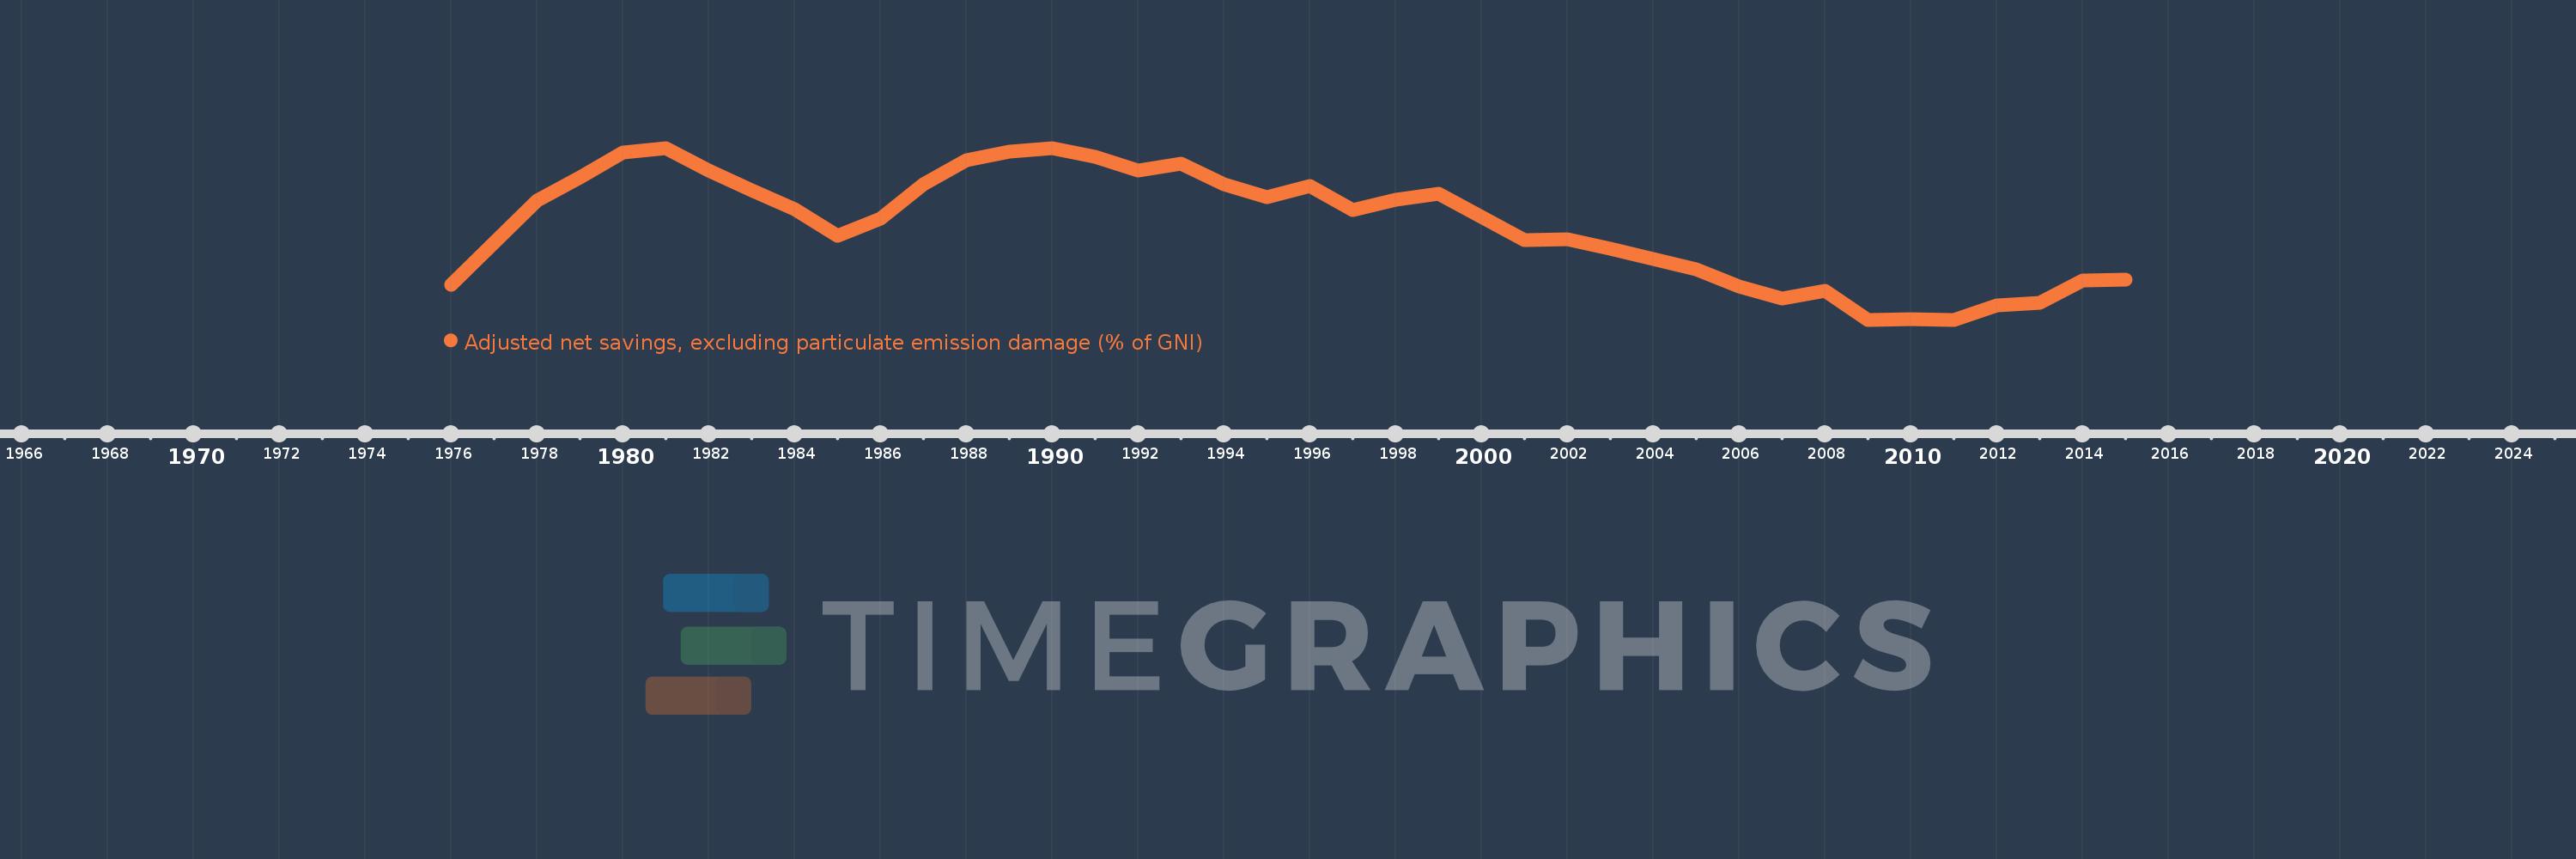
Adjusted net savings, excluding particulate emission damage (% of GNI)
2015,2014,2013,2012,2011,2010,2009,2008,2007,2006,2005,2004,2003,2002,2001,2000,1999,1998,1997,1996,1995,1994,1993,1992,1991,1990,1989,1988,1987,1986,1985,1984,1983,1982,1981,1980,1979,1978,1977,1976
Queste statistiche in altri paesi:
AfghanistanAlbaniaAlgeriaAngolaArab WorldArgentinaArmeniaAustraliaAustriaAzerbaijanBahamas, TheBahrainBangladeshBarbadosBelarusBelgiumBelizeBeninBhutanBoliviaBotswanaBrazilBrunei DarussalamBulgariaBurkina FasoBurundiCabo VerdeCambodiaCameroonCanadaCaribbean small statesCentral African RepublicCentral Europe and the BalticsChadChileChinaColombiaComorosCongo, Dem. Rep.Congo, Rep.Costa RicaCote d'IvoireCroatiaCyprusCzech RepublicDenmarkDjiboutiDominicaDominican RepublicEarly-demographic dividendEast Asia & PacificEast Asia & Pacific (excluding high income)East Asia & Pacific (IDA & IBRD countries)EcuadorEgypt, Arab Rep.El SalvadorEquatorial GuineaEritreaEstoniaEthiopiaEuro areaEurope & Central AsiaEurope & Central Asia (excluding high income)Europe & Central Asia (IDA & IBRD countries)European UnionFijiFinlandFragile and conflict affected situationsFranceGabonGambia, TheGeorgiaGermanyGhanaGreeceGuatemalaGuineaGuinea-BissauGuyanaHaitiHeavily indebted poor countries (HIPC)High incomeHondurasHungaryIBRD onlyIcelandIDA & IBRD totalIDA blendIDA onlyIDA totalIndiaIndonesiaIran, Islamic Rep.IraqIrelandIsraelItalyJamaicaJapanJordanKazakhstanKenyaKiribatiKorea, Rep.KuwaitKyrgyz RepublicLao PDRLate-demographic dividendLatin America & Caribbean Latin America & Caribbean (excluding high income)Latin America & the Caribbean (IDA & IBRD countries)LatviaLeast developed countries: UN classificationLebanonLesothoLiberiaLibyaLithuaniaLow & middle incomeLow incomeLower middle incomeLuxembourgMacedonia, FYRMadagascarMalawiMalaysiaMaldivesMaliMauritaniaMauritiusMexicoMiddle East & North AfricaMiddle East & North Africa (excluding high income)Middle East & North Africa (IDA & IBRD countries)Middle incomeMoldovaMongoliaMoroccoMozambiqueNamibiaNepalNetherlandsNew ZealandNicaraguaNigerNigeriaNorth AmericaNorwayOECD membersOmanOther small statesPacific island small statesPakistanPanamaPapua New GuineaParaguayPeruPhilippinesPolandPortugalPost-demographic dividendPre-demographic dividendQatarRomaniaRussian FederationRwandaSaudi ArabiaSenegalSeychellesSierra LeoneSingaporeSlovak RepublicSloveniaSmall statesSolomon IslandsSouth AfricaSouth AsiaSouth Asia (IDA & IBRD)SpainSri LankaSt. LuciaSt. Vincent and the GrenadinesSub-Saharan Africa Sub-Saharan Africa (excluding high income)Sub-Saharan Africa (IDA & IBRD countries)SudanSurinameSwazilandSwedenSwitzerlandSyrian Arab RepublicTajikistanTanzaniaThailandTogoTongaTrinidad and TobagoTunisiaTurkeyUgandaUkraineUnited KingdomUnited StatesUpper middle incomeUruguayVanuatuVenezuela, RBVietnamWorldYemen, Rep.ZambiaZimbabwe Linea del tempo:
Questa scala temporale mostra un grafico dal 1976 anno al 2015 anno. Portugal. I dati fino ad 1975 anno non disponibili. Il numero di osservazioni attuali secondo i date: 40.
La fonte (nome):
Indicatori dello sviluppo mondiale
La fonte (organizzazione):
World Bank staff estimates based on sources and methods in World Bank's "The Changing Wealth of Nations: Measuring Sustainable Development in the New Millennium" (2011).
Categorie:
Economy & Growth, Environment
sono stati aggiornati
23 apr 2017 anni
Indicatori delle variazioni dei valori per anni
Minima:
-1.988
1 gen 2011 anni
Massimo:
17.306
1 gen 1981 anni
Alla data di osservazione
Valore
Variazione assoluta
La variazione rispetto al valore precedente
1 gen 1976 anni
1.894
+1.894
0.0%
1 gen 1977 anni
6.619
+4.725
249.45%
1 gen 1978 anni
11.365
+4.746
71.71%
1 gen 1979 anni
13.968
+2.602
22.9%
1 gen 1980 anni
16.809
+2.841
20.34%
1 gen 1981 anni
17.306
+0.497
2.96%
1 gen 1982 anni
14.751
-2.555
-14.76%
1 gen 1983 anni
12.557
-2.195
-14.88%
1 gen 1984 anni
10.423
-2.133
-16.99%
1 gen 1985 anni
7.405
-3.018
-28.96%
1 gen 1986 anni
9.372
+1.967
26.56%
1 gen 1987 anni
13.182
+3.81
40.65%
1 gen 1988 anni
15.961
+2.779
21.08%
1 gen 1989 anni
16.852
+0.891
5.58%
1 gen 1990 anni
17.282
+0.43
2.55%
1 gen 1991 anni
16.33
-0.952
-5.51%
1 gen 1992 anni
14.76
-1.57
-9.62%
1 gen 1993 anni
15.561
+0.802
5.43%
1 gen 1994 anni
13.215
-2.347
-15.08%
1 gen 1995 anni
11.759
-1.456
-11.02%
1 gen 1996 anni
13.077
+1.318
11.21%
1 gen 1997 anni
10.357
-2.721
-20.8%
1 gen 1998 anni
11.498
+1.141
11.02%
1 gen 1999 anni
12.169
+0.671
5.83%
1 gen 2000 anni
9.574
-2.595
-21.32%
1 gen 2001 anni
6.941
-2.633
-27.5%
1 gen 2002 anni
7.006
+0.066
0.95%
1 gen 2003 anni
6.017
-0.99
-14.13%
1 gen 2004 anni
4.849
-1.167
-19.4%
1 gen 2005 anni
3.715
-1.135
-23.4%
1 gen 2006 anni
1.728
-1.986
-53.47%
1 gen 2007 anni
0.423
-1.306
-75.53%
1 gen 2008 anni
1.31
+0.887
209.84%
1 gen 2009 anni
-1.978
-3.289
-251.01%
1 gen 2010 anni
-1.892
+0.087
-4.39%
1 gen 2011 anni
-1.988
-0.096
5.09%
1 gen 2012 anni
-0.382
+1.606
-80.78%
1 gen 2013 anni
-0.06
+0.322
-84.4%
1 gen 2014 anni
2.448
+2.507
-4.21 Mille.%
1 gen 2015 anni
2.544
+0.096
3.92%
Classificazione dei paesi secondo i statistiche attuali per anni


Commenti: