29
/it/
it
AIzaSyAYiBZKx7MnpbEhh9jyipgxe19OcubqV5w
April 1, 2024
24639
Caribbean small states
CSS
false
2
1
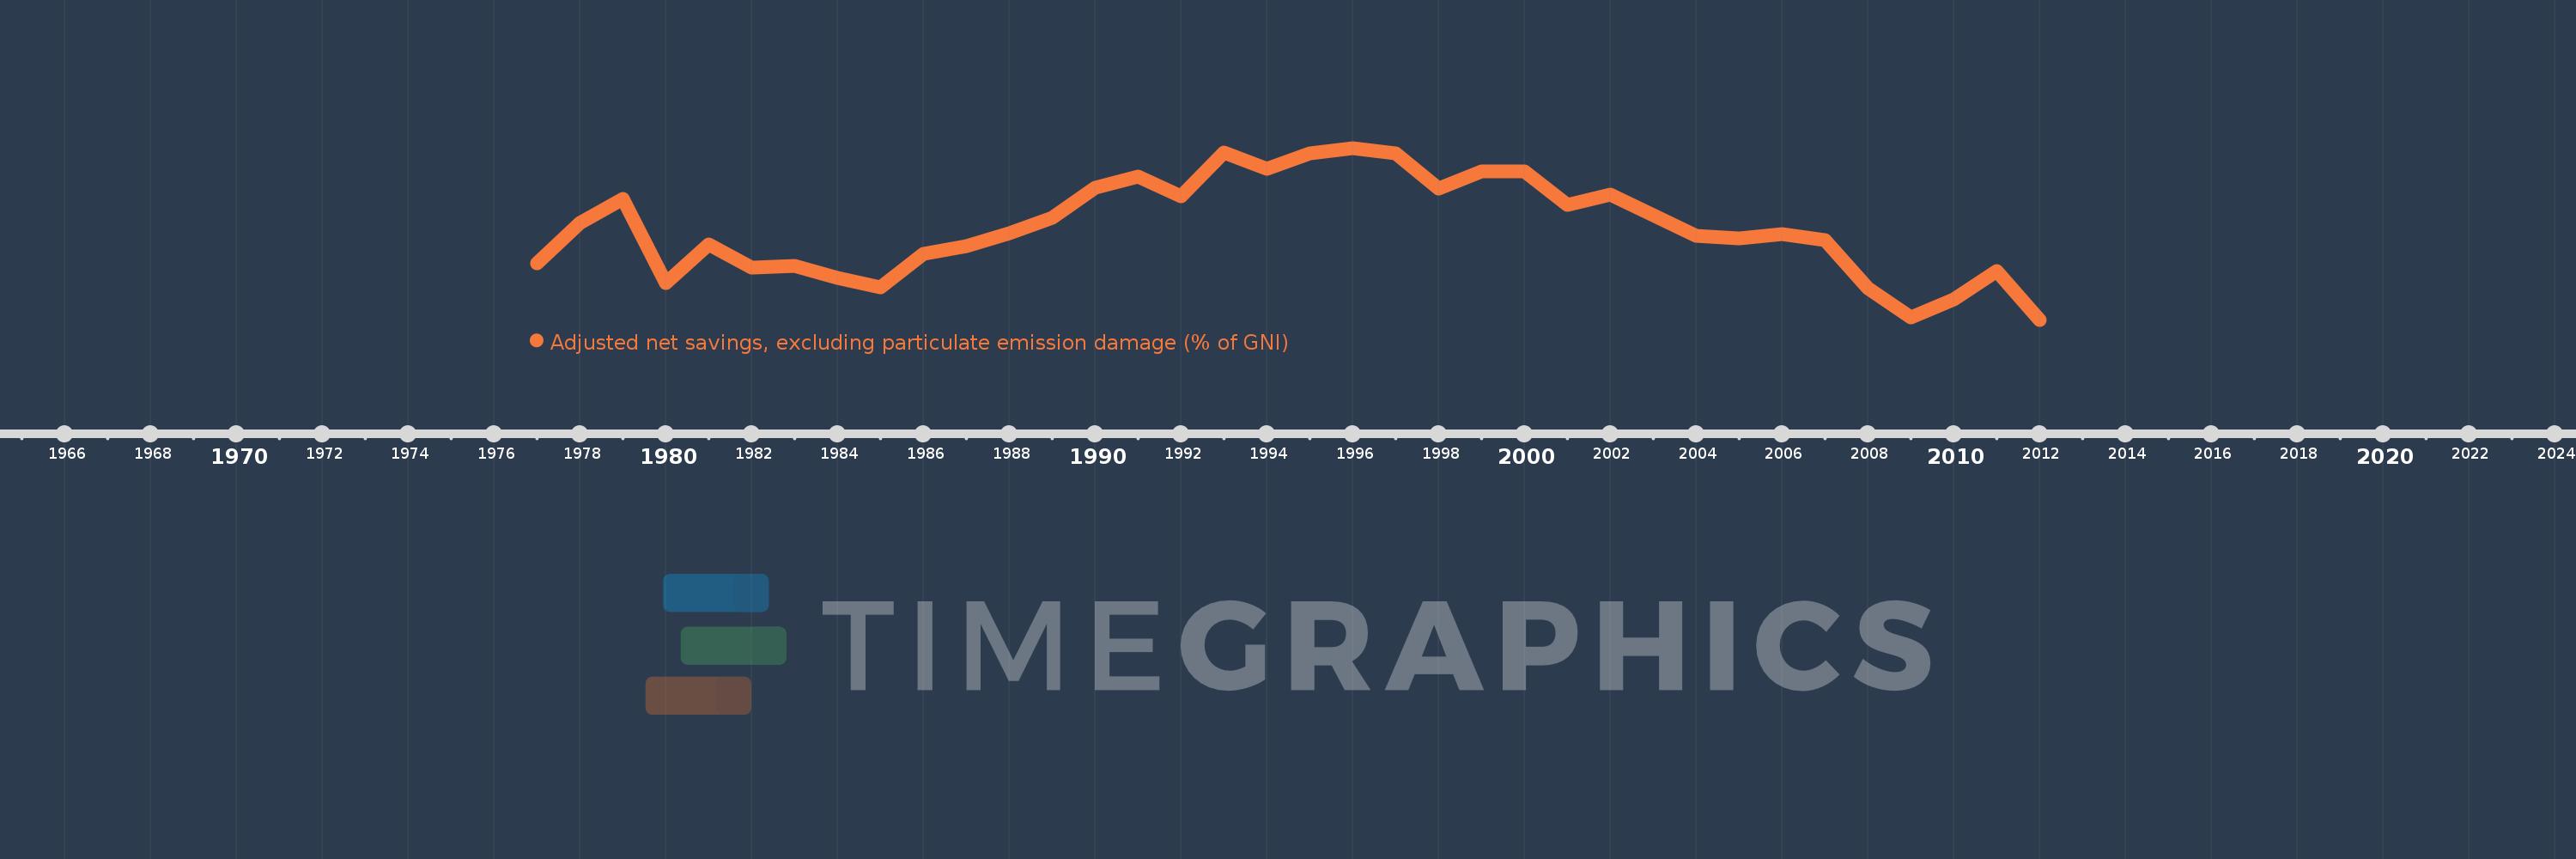
Adjusted net savings, excluding particulate emission damage (% of GNI)
2012,2011,2010,2009,2008,2007,2006,2005,2004,2003,2002,2001,2000,1999,1998,1997,1996,1995,1994,1993,1992,1991,1990,1989,1988,1987,1986,1985,1984,1983,1982,1981,1980,1979,1978,1977
Queste statistiche in altri paesi:
AfghanistanAlbaniaAlgeriaAngolaArab WorldArgentinaArmeniaAustraliaAustriaAzerbaijanBahamas, TheBahrainBangladeshBarbadosBelarusBelgiumBelizeBeninBhutanBoliviaBotswanaBrazilBrunei DarussalamBulgariaBurkina FasoBurundiCabo VerdeCambodiaCameroonCanadaCaribbean small statesCentral African RepublicCentral Europe and the BalticsChadChileChinaColombiaComorosCongo, Dem. Rep.Congo, Rep.Costa RicaCote d'IvoireCroatiaCyprusCzech RepublicDenmarkDjiboutiDominicaDominican RepublicEarly-demographic dividendEast Asia & PacificEast Asia & Pacific (excluding high income)East Asia & Pacific (IDA & IBRD countries)EcuadorEgypt, Arab Rep.El SalvadorEquatorial GuineaEritreaEstoniaEthiopiaEuro areaEurope & Central AsiaEurope & Central Asia (excluding high income)Europe & Central Asia (IDA & IBRD countries)European UnionFijiFinlandFragile and conflict affected situationsFranceGabonGambia, TheGeorgiaGermanyGhanaGreeceGuatemalaGuineaGuinea-BissauGuyanaHaitiHeavily indebted poor countries (HIPC)High incomeHondurasHungaryIBRD onlyIcelandIDA & IBRD totalIDA blendIDA onlyIDA totalIndiaIndonesiaIran, Islamic Rep.IraqIrelandIsraelItalyJamaicaJapanJordanKazakhstanKenyaKiribatiKorea, Rep.KuwaitKyrgyz RepublicLao PDRLate-demographic dividendLatin America & Caribbean Latin America & Caribbean (excluding high income)Latin America & the Caribbean (IDA & IBRD countries)LatviaLeast developed countries: UN classificationLebanonLesothoLiberiaLibyaLithuaniaLow & middle incomeLow incomeLower middle incomeLuxembourgMacedonia, FYRMadagascarMalawiMalaysiaMaldivesMaliMauritaniaMauritiusMexicoMiddle East & North AfricaMiddle East & North Africa (excluding high income)Middle East & North Africa (IDA & IBRD countries)Middle incomeMoldovaMongoliaMoroccoMozambiqueNamibiaNepalNetherlandsNew ZealandNicaraguaNigerNigeriaNorth AmericaNorwayOECD membersOmanOther small statesPacific island small statesPakistanPanamaPapua New GuineaParaguayPeruPhilippinesPolandPortugalPost-demographic dividendPre-demographic dividendQatarRomaniaRussian FederationRwandaSaudi ArabiaSenegalSeychellesSierra LeoneSingaporeSlovak RepublicSloveniaSmall statesSolomon IslandsSouth AfricaSouth AsiaSouth Asia (IDA & IBRD)SpainSri LankaSt. LuciaSt. Vincent and the GrenadinesSub-Saharan Africa Sub-Saharan Africa (excluding high income)Sub-Saharan Africa (IDA & IBRD countries)SudanSurinameSwazilandSwedenSwitzerlandSyrian Arab RepublicTajikistanTanzaniaThailandTogoTongaTrinidad and TobagoTunisiaTurkeyUgandaUkraineUnited KingdomUnited StatesUpper middle incomeUruguayVanuatuVenezuela, RBVietnamWorldYemen, Rep.ZambiaZimbabwe Linea del tempo:
Questa scala temporale mostra un grafico dal 1977 anno al 2012 anno. Caribbean small states. I dati fino ad 1976 anno non disponibili. Il numero di osservazioni attuali secondo i date: 36.
La fonte (nome):
Indicatori dello sviluppo mondiale
La fonte (organizzazione):
World Bank staff estimates based on sources and methods in World Bank's "The Changing Wealth of Nations: Measuring Sustainable Development in the New Millennium" (2011).
Categorie:
Economy & Growth, Environment
sono stati aggiornati
23 apr 2017 anni
Indicatori delle variazioni dei valori per anni
Minima:
-4.682
1 gen 2012 anni
Massimo:
16.519
1 gen 1996 anni
Alla data di osservazione
Valore
Variazione assoluta
La variazione rispetto al valore precedente
1 gen 1977 anni
2.258
+2.258
0.0%
1 gen 1978 anni
7.279
+5.021
222.35%
1 gen 1979 anni
10.235
+2.956
40.6%
1 gen 1980 anni
-0.171
-10.406
-101.67%
1 gen 1981 anni
4.665
+4.837
-2.82 Mille.%
1 gen 1982 anni
1.754
-2.911
-62.4%
1 gen 1983 anni
1.948
+0.194
11.07%
1 gen 1984 anni
0.508
-1.44
-73.92%
1 gen 1985 anni
-0.716
-1.224
-241.02%
1 gen 1986 anni
3.426
+4.143
-578.3%
1 gen 1987 anni
4.405
+0.979
28.57%
1 gen 1988 anni
5.999
+1.593
36.17%
1 gen 1989 anni
7.93
+1.932
32.21%
1 gen 1990 anni
11.582
+3.651
46.04%
1 gen 1991 anni
13.036
+1.454
12.56%
1 gen 1992 anni
10.561
-2.475
-18.99%
1 gen 1993 anni
15.91
+5.349
50.65%
1 gen 1994 anni
13.968
-1.942
-12.2%
1 gen 1995 anni
15.802
+1.834
13.13%
1 gen 1996 anni
16.519
+0.717
4.54%
1 gen 1997 anni
15.867
-0.652
-3.95%
1 gen 1998 anni
11.546
-4.321
-27.23%
1 gen 1999 anni
13.587
+2.041
17.68%
1 gen 2000 anni
13.673
+0.086
0.63%
1 gen 2001 anni
9.52
-4.153
-30.38%
1 gen 2002 anni
10.721
+1.201
12.62%
1 gen 2003 anni
8.187
-2.534
-23.64%
1 gen 2004 anni
5.711
-2.476
-30.24%
1 gen 2005 anni
5.336
-0.375
-6.57%
1 gen 2006 anni
5.929
+0.592
11.1%
1 gen 2007 anni
5.145
-0.784
-13.22%
1 gen 2008 anni
-0.841
-5.986
-116.35%
1 gen 2009 anni
-4.412
-3.57
424.36%
1 gen 2010 anni
-2.161
+2.251
-51.01%
1 gen 2011 anni
1.368
+3.529
-163.3%
1 gen 2012 anni
-4.682
-6.05
-442.22%
Classificazione dei paesi secondo i statistiche attuali per anni


Commenti: