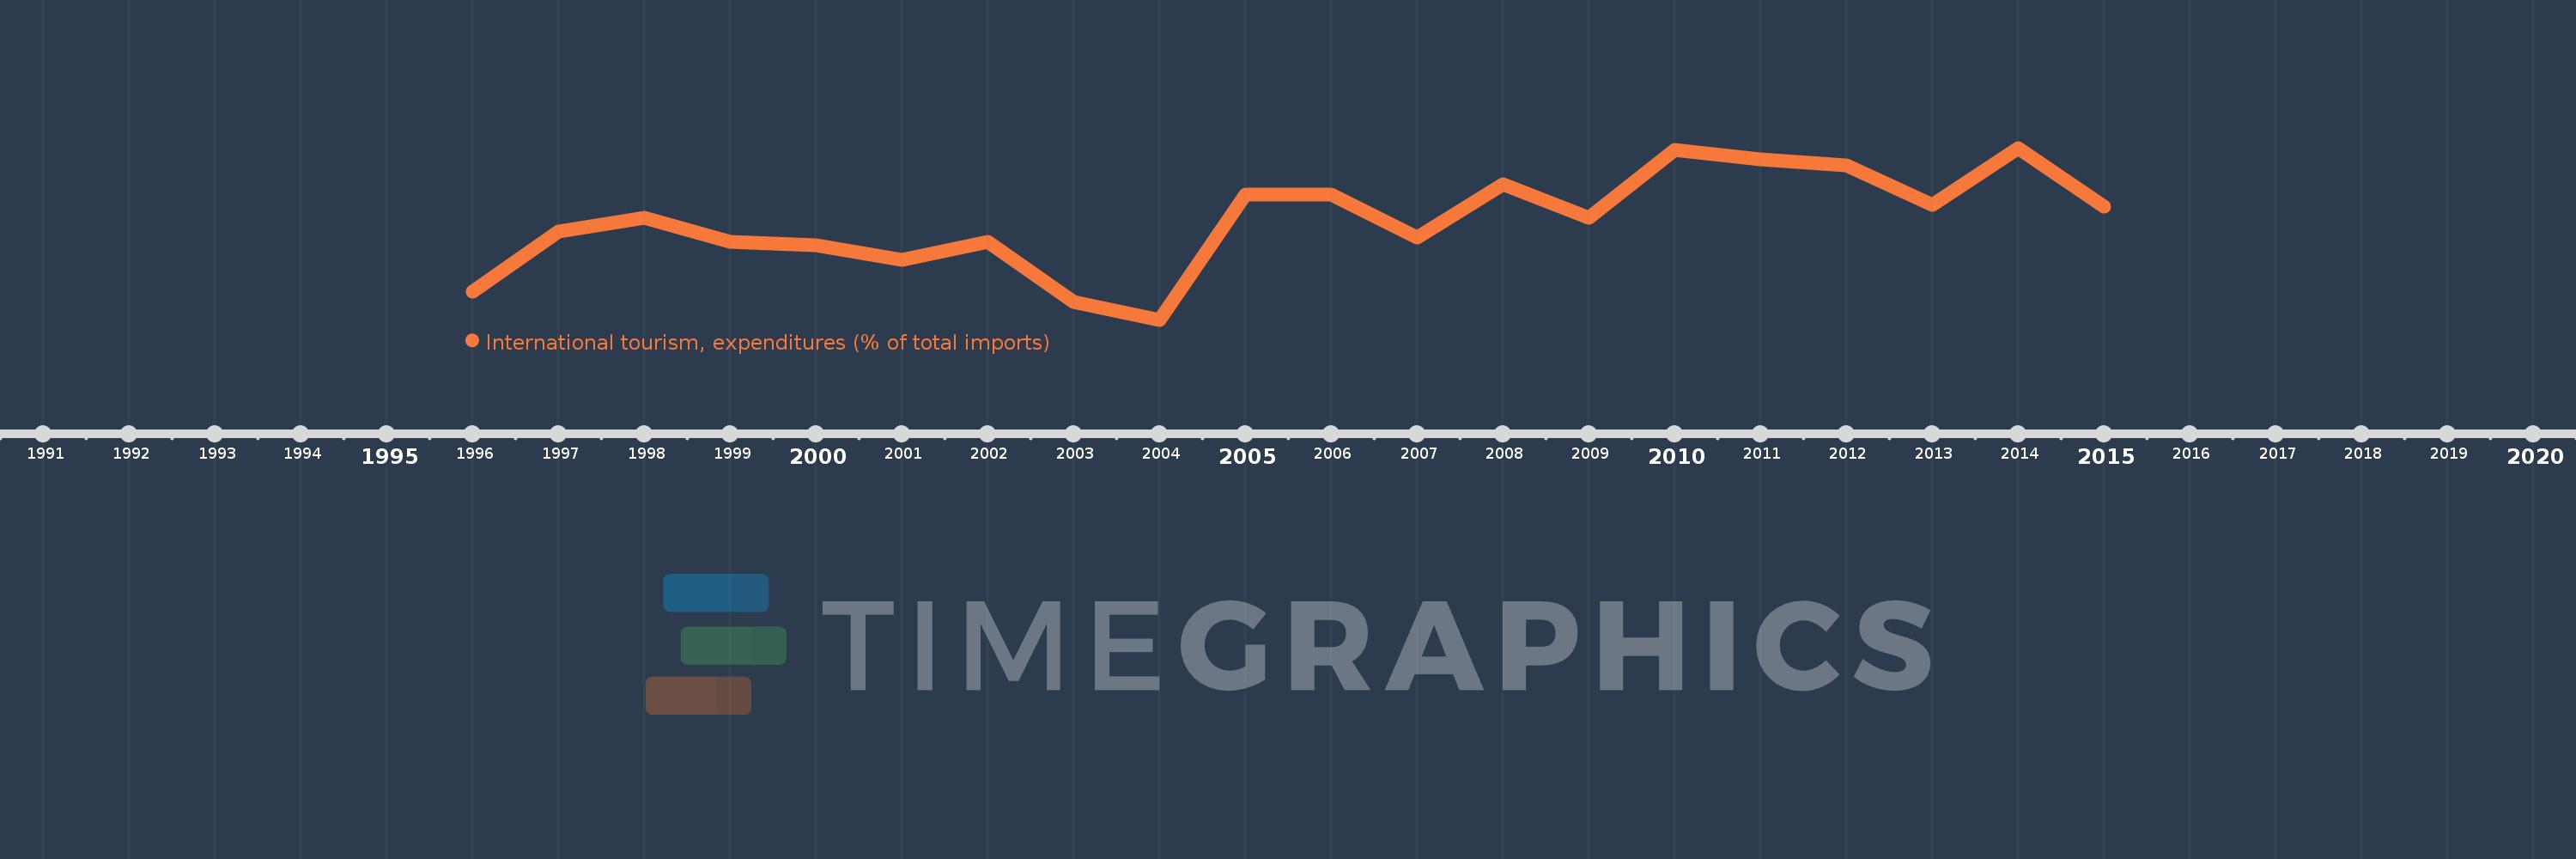
Questa scala temporale mostra un grafico dal 1996 anno al 2015 anno. Australia. I dati fino ad 1995 anno non disponibili. Il numero di osservazioni attuali secondo i date: 20.
La fonte (nome):
Indicatori dello sviluppo mondiale
La fonte (organizzazione):
World Tourism Organization, Yearbook of Tourism Statistics, Compendium of Tourism Statistics and data files, and IMF and World Bank imports estimates.
Categorie:
Private Sector, Trade
sono stati aggiornati
23 apr 2017 anni
Indicatori delle variazioni dei valori per anni
In media:
10.343
Minima:
9.341
1 gen 2004 anni
Massimo:
11.08
1 gen 2014 anni
Alla data di osservazione
Valore
Variazione assoluta
La variazione rispetto al valore precedente
1 gen 1996 anni
9.626
+9.626
0.0%
1 gen 1997 anni
10.231
+0.605
6.28%
1 gen 1998 anni
10.376
+0.146
1.42%
1 gen 1999 anni
10.128
-0.248
-2.39%
1 gen 2000 anni
10.099
-0.029
-0.29%
1 gen 2001 anni
9.947
-0.152
-1.5%
1 gen 2002 anni
10.132
+0.185
1.86%
1 gen 2003 anni
9.521
-0.612
-6.04%
1 gen 2004 anni
9.341
-0.18
-1.89%
1 gen 2005 anni
10.608
+1.267
13.57%
1 gen 2006 anni
10.609
+0.001
0.01%
1 gen 2007 anni
10.171
-0.438
-4.13%
1 gen 2008 anni
10.714
+0.543
5.34%
1 gen 2009 anni
10.371
-0.343
-3.2%
1 gen 2010 anni
11.056
+0.685
6.6%
1 gen 2011 anni
10.962
-0.094
-0.85%
1 gen 2012 anni
10.901
-0.061
-0.56%
1 gen 2013 anni
10.505
-0.396
-3.63%
1 gen 2014 anni
11.08
+0.575
5.47%
1 gen 2015 anni
10.488
-0.592
-5.34%
Classificazione dei paesi secondo i statistiche attuali per anni
