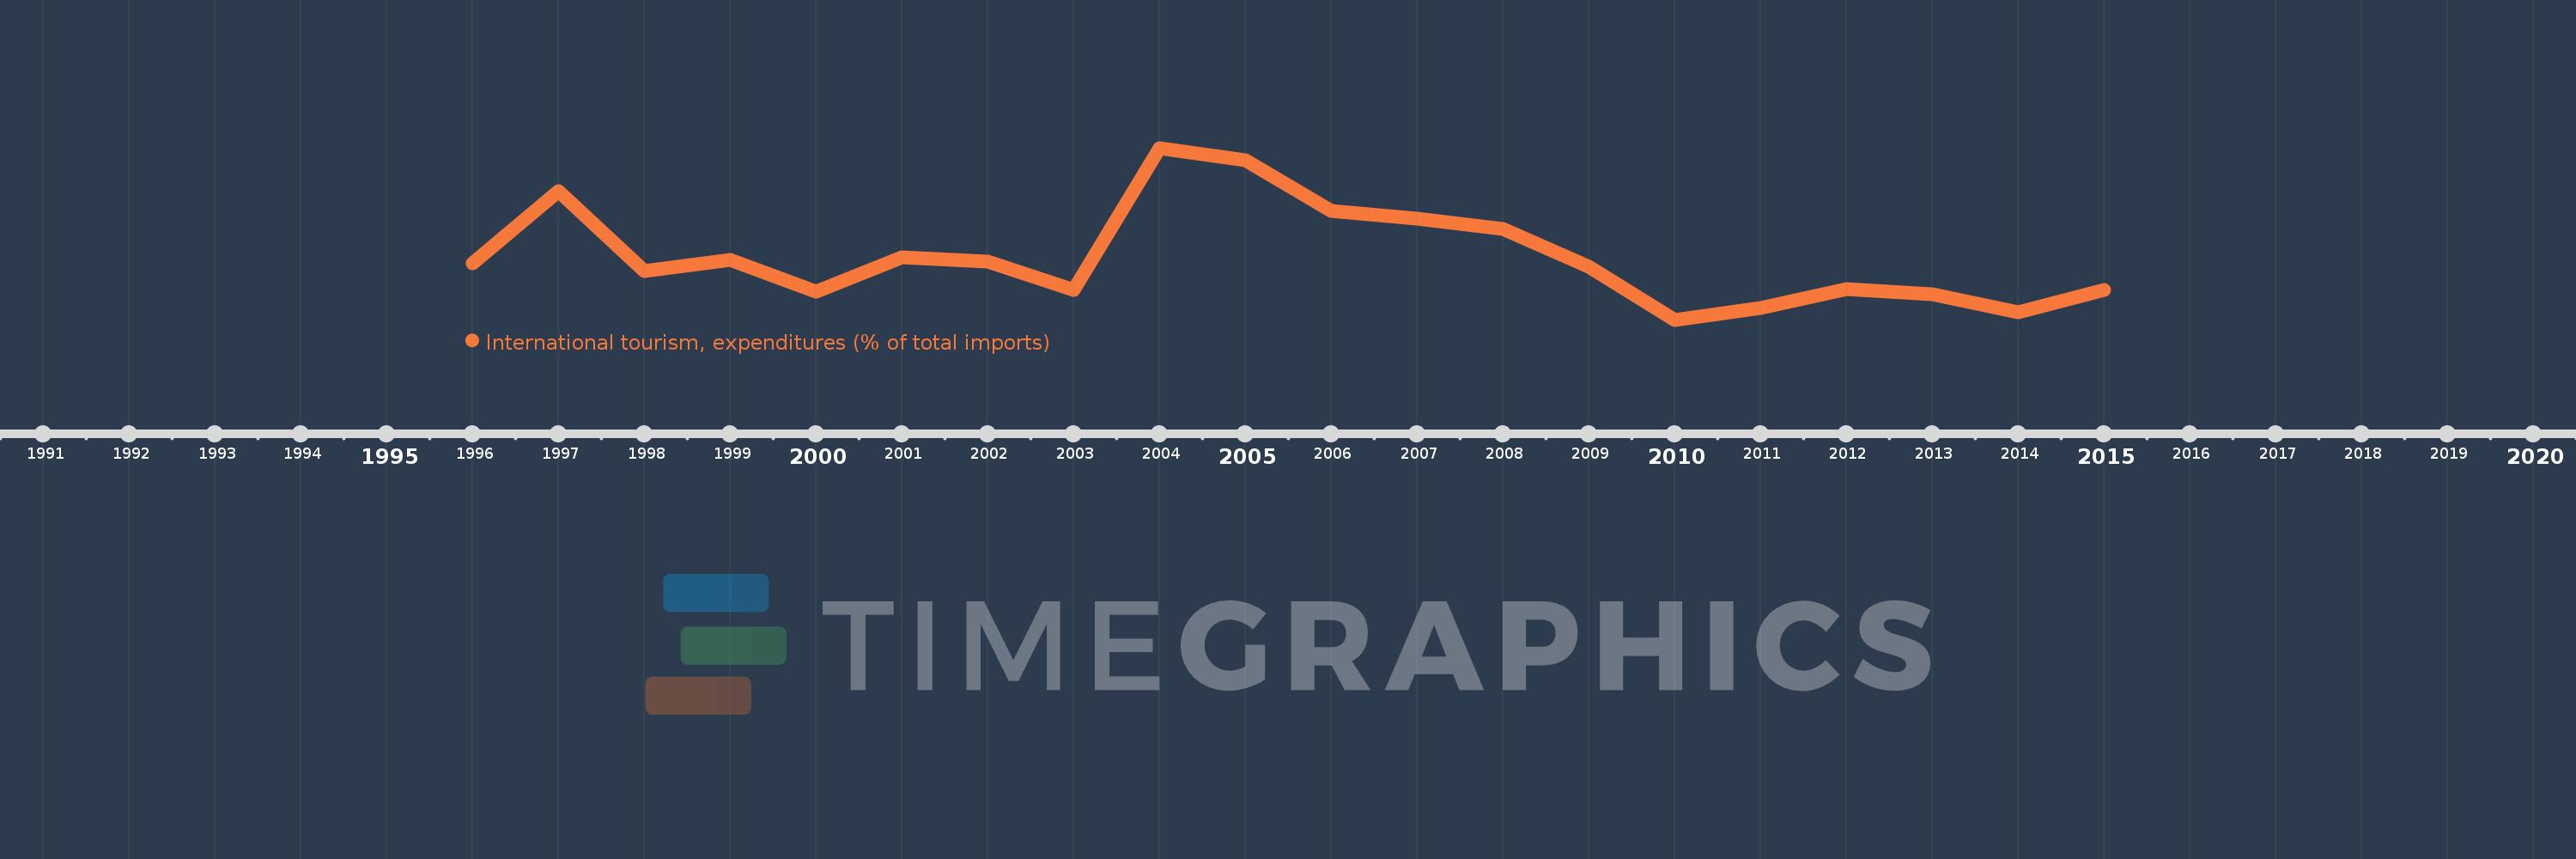
Questa scala temporale mostra un grafico dal 1996 anno al 2015 anno. Pakistan. I dati fino ad 1995 anno non disponibili. Il numero di osservazioni attuali secondo i date: 20.
La fonte (nome):
Indicatori dello sviluppo mondiale
La fonte (organizzazione):
World Tourism Organization, Yearbook of Tourism Statistics, Compendium of Tourism Statistics and data files, and IMF and World Bank imports estimates.
Categorie:
Private Sector, Trade
sono stati aggiornati
23 apr 2017 anni
Indicatori delle variazioni dei valori per anni
In media:
4.786
Minima:
3.124
1 gen 2010 anni
Massimo:
7.646
1 gen 2004 anni
Alla data di osservazione
Valore
Variazione assoluta
La variazione rispetto al valore precedente
1 gen 1996 anni
4.61
+4.61
0.0%
1 gen 1997 anni
6.516
+1.906
41.34%
1 gen 1998 anni
4.408
-2.109
-32.36%
1 gen 1999 anni
4.71
+0.302
6.86%
1 gen 2000 anni
3.865
-0.845
-17.94%
1 gen 2001 anni
4.773
+0.908
23.49%
1 gen 2002 anni
4.644
-0.129
-2.71%
1 gen 2003 anni
3.907
-0.736
-15.85%
1 gen 2004 anni
7.646
+3.739
95.69%
1 gen 2005 anni
7.325
-0.321
-4.2%
1 gen 2006 anni
5.988
-1.337
-18.25%
1 gen 2007 anni
5.781
-0.207
-3.46%
1 gen 2008 anni
5.521
-0.26
-4.5%
1 gen 2009 anni
4.513
-1.008
-18.25%
1 gen 2010 anni
3.124
-1.389
-30.78%
1 gen 2011 anni
3.424
+0.3
9.6%
1 gen 2012 anni
3.938
+0.515
15.04%
1 gen 2013 anni
3.785
-0.153
-3.89%
1 gen 2014 anni
3.332
-0.454
-11.98%
1 gen 2015 anni
3.912
+0.581
17.44%
Classificazione dei paesi secondo i statistiche attuali per anni
