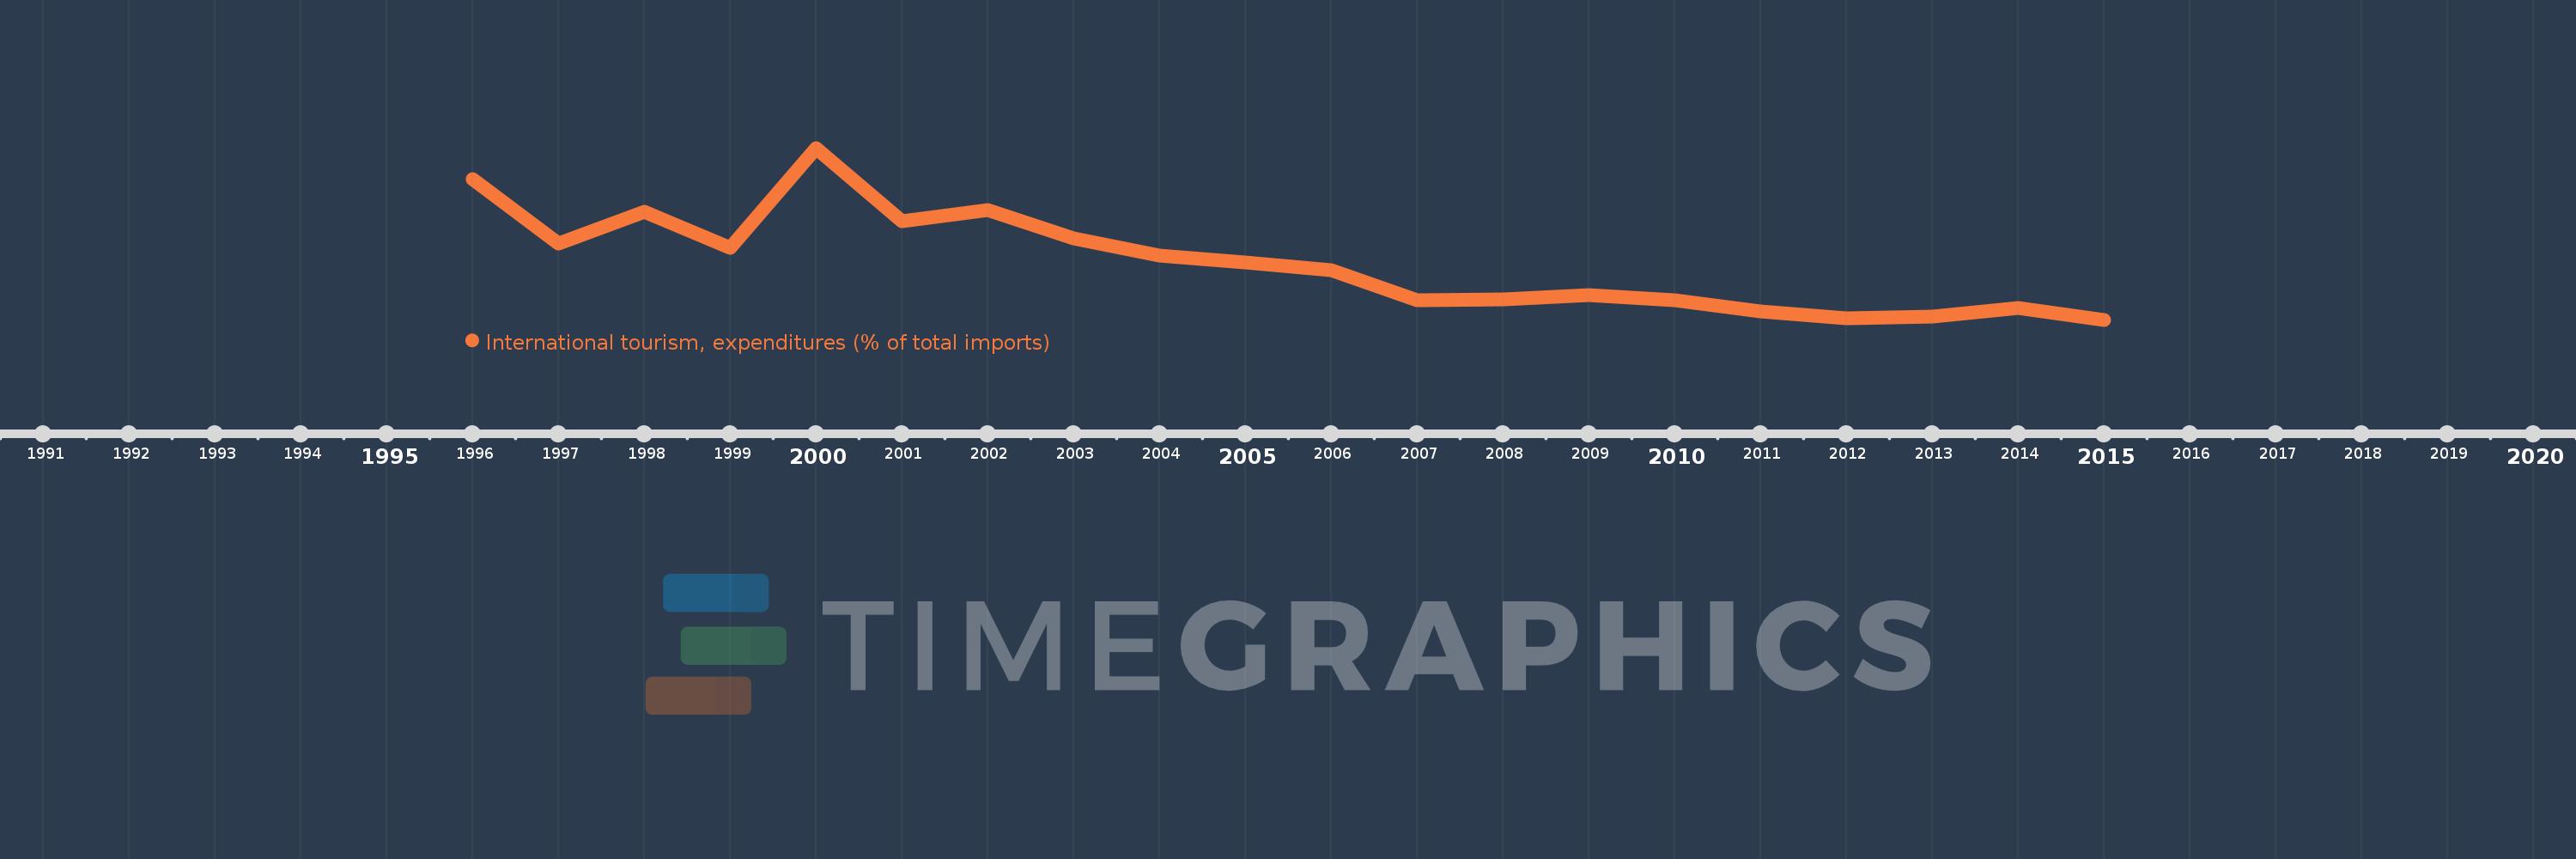
Questa scala temporale mostra un grafico dal 1996 anno al 2015 anno. Sierra Leone. I dati fino ad 1995 anno non disponibili. Il numero di osservazioni attuali secondo i date: 20.
La fonte (nome):
Indicatori dello sviluppo mondiale
La fonte (organizzazione):
World Tourism Organization, Yearbook of Tourism Statistics, Compendium of Tourism Statistics and data files, and IMF and World Bank imports estimates.
Categorie:
Private Sector, Trade
sono stati aggiornati
23 apr 2017 anni
Indicatori delle variazioni dei valori per anni
In media:
8.37
Minima:
0.844
1 gen 2015 anni
Massimo:
23.547
1 gen 2000 anni
Alla data di osservazione
Valore
Variazione assoluta
La variazione rispetto al valore precedente
1 gen 1996 anni
19.425
+19.425
0.0%
1 gen 1997 anni
10.922
-8.503
-43.77%
1 gen 1998 anni
15.122
+4.199
38.45%
1 gen 1999 anni
10.309
-4.813
-31.83%
1 gen 2000 anni
23.547
+13.239
128.42%
1 gen 2001 anni
13.813
-9.734
-41.34%
1 gen 2002 anni
15.288
+1.475
10.68%
1 gen 2003 anni
11.647
-3.641
-23.82%
1 gen 2004 anni
9.345
-2.302
-19.76%
1 gen 2005 anni
8.446
-0.899
-9.62%
1 gen 2006 anni
7.417
-1.03
-12.19%
1 gen 2007 anni
3.447
-3.97
-53.53%
1 gen 2008 anni
3.532
+0.086
2.48%
1 gen 2009 anni
4.12
+0.588
16.65%
1 gen 2010 anni
3.468
-0.652
-15.82%
1 gen 2011 anni
1.943
-1.526
-43.99%
1 gen 2012 anni
1.047
-0.896
-46.12%
1 gen 2013 anni
1.282
+0.235
22.47%
1 gen 2014 anni
2.433
+1.151
89.81%
1 gen 2015 anni
0.844
-1.589
-65.3%
Classificazione dei paesi secondo i statistiche attuali per anni
