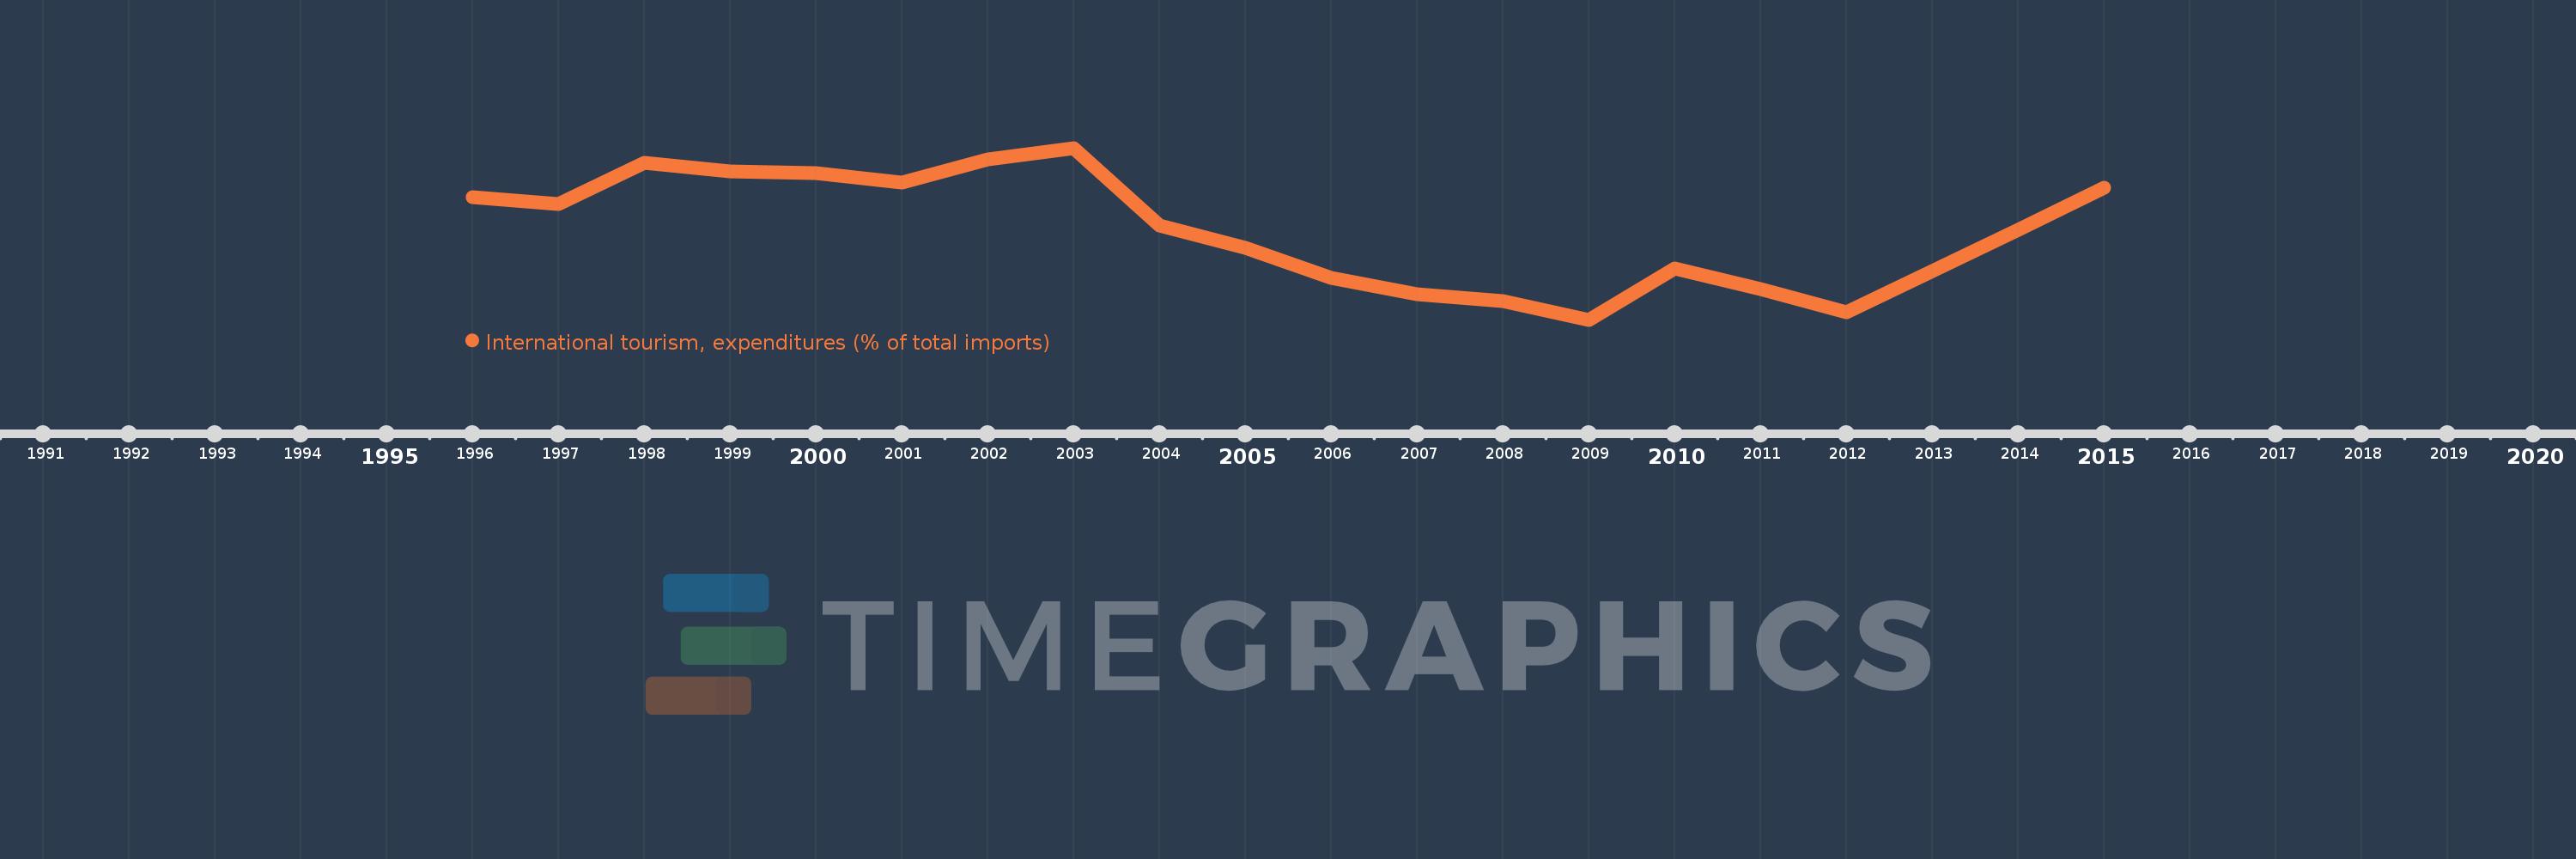
Questa scala temporale mostra un grafico dal 1996 anno al 2015 anno. IDA & IBRD total. I dati fino ad 1995 anno non disponibili. Il numero di osservazioni attuali secondo i date: 20.
La fonte (nome):
Indicatori dello sviluppo mondiale
La fonte (organizzazione):
World Tourism Organization, Yearbook of Tourism Statistics, Compendium of Tourism Statistics and data files, and IMF and World Bank imports estimates.
Categorie:
Private Sector, Trade
sono stati aggiornati
23 apr 2017 anni
Indicatori delle variazioni dei valori per anni
In media:
5.469
Minima:
4.349
1 gen 2009 anni
Massimo:
6.519
1 gen 2003 anni
Alla data di osservazione
Valore
Variazione assoluta
La variazione rispetto al valore precedente
1 gen 1996 anni
5.895
+5.895
0.0%
1 gen 1997 anni
5.807
-0.087
-1.48%
1 gen 1998 anni
6.334
+0.527
9.07%
1 gen 1999 anni
6.225
-0.109
-1.72%
1 gen 2000 anni
6.205
-0.021
-0.33%
1 gen 2001 anni
6.083
-0.121
-1.96%
1 gen 2002 anni
6.379
+0.295
4.85%
1 gen 2003 anni
6.519
+0.14
2.2%
1 gen 2004 anni
5.544
-0.975
-14.96%
1 gen 2005 anni
5.254
-0.289
-5.22%
1 gen 2006 anni
4.879
-0.375
-7.13%
1 gen 2007 anni
4.672
-0.207
-4.24%
1 gen 2008 anni
4.586
-0.086
-1.85%
1 gen 2009 anni
4.349
-0.237
-5.18%
1 gen 2010 anni
5.0
+0.652
14.99%
1 gen 2011 anni
4.734
-0.267
-5.34%
1 gen 2012 anni
4.438
-0.295
-6.23%
1 gen 2013 anni
4.962
+0.523
11.79%
1 gen 2014 anni
5.486
+0.525
10.57%
1 gen 2015 anni
6.021
+0.535
9.75%
Classificazione dei paesi secondo i statistiche attuali per anni
