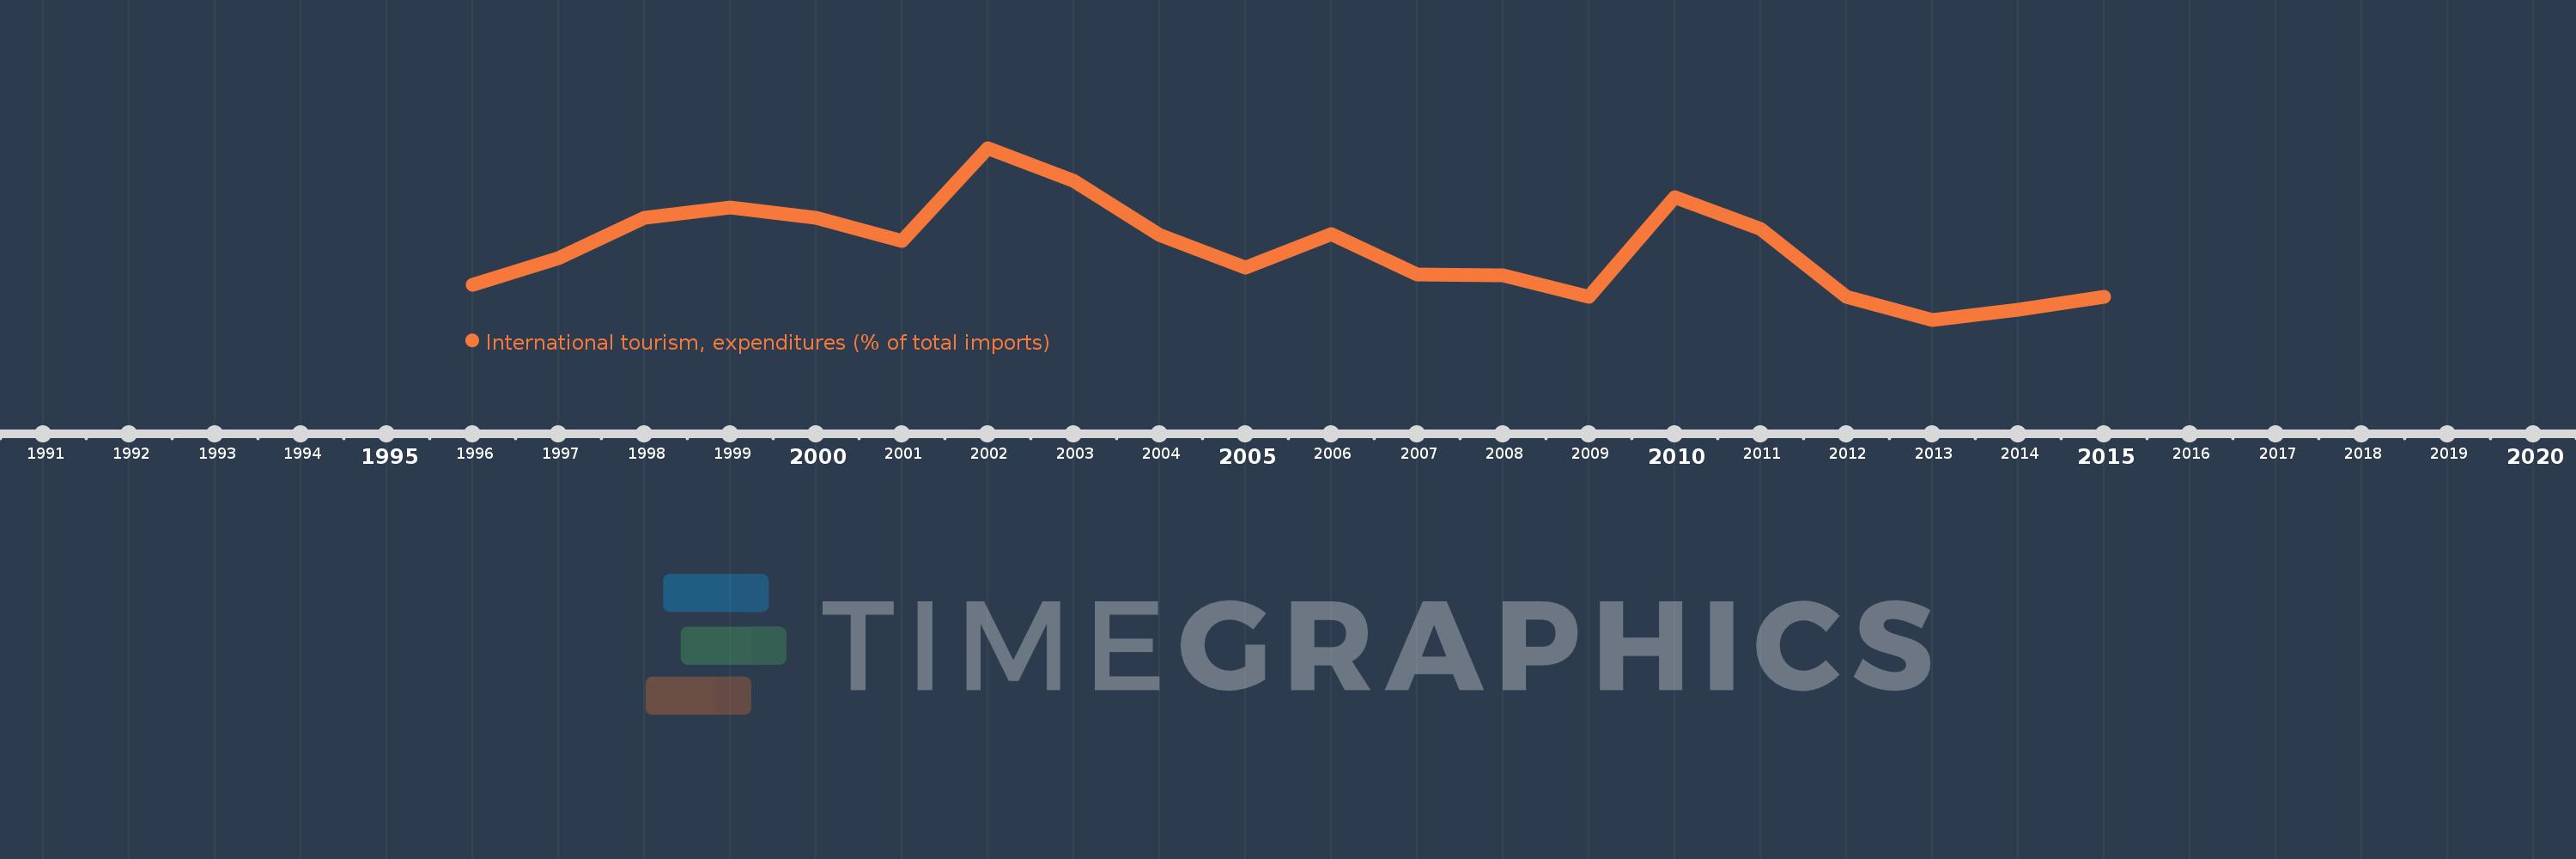
Questa scala temporale mostra un grafico dal 1996 anno al 2015 anno. Turkey. I dati fino ad 1995 anno non disponibili. Il numero di osservazioni attuali secondo i date: 20.
La fonte (nome):
Indicatori dello sviluppo mondiale
La fonte (organizzazione):
World Tourism Organization, Yearbook of Tourism Statistics, Compendium of Tourism Statistics and data files, and IMF and World Bank imports estimates.
Categorie:
Private Sector, Trade
sono stati aggiornati
23 apr 2017 anni
Indicatori delle variazioni dei valori per anni
In media:
2.701
Minima:
1.847
1 gen 2013 anni
Massimo:
3.933
1 gen 2002 anni
Alla data di osservazione
Valore
Variazione assoluta
La variazione rispetto al valore precedente
1 gen 1996 anni
2.271
+2.271
0.0%
1 gen 1997 anni
2.594
+0.323
14.24%
1 gen 1998 anni
3.083
+0.488
18.82%
1 gen 1999 anni
3.21
+0.127
4.14%
1 gen 2000 anni
3.081
-0.13
-4.04%
1 gen 2001 anni
2.807
-0.274
-8.89%
1 gen 2002 anni
3.933
+1.126
40.14%
1 gen 2003 anni
3.53
-0.403
-10.24%
1 gen 2004 anni
2.874
-0.656
-18.59%
1 gen 2005 anni
2.484
-0.39
-13.58%
1 gen 2006 anni
2.887
+0.404
16.26%
1 gen 2007 anni
2.395
-0.493
-17.06%
1 gen 2008 anni
2.388
-0.007
-0.27%
1 gen 2009 anni
2.127
-0.262
-10.95%
1 gen 2010 anni
3.339
+1.212
57.0%
1 gen 2011 anni
2.952
-0.386
-11.57%
1 gen 2012 anni
2.127
-0.825
-27.95%
1 gen 2013 anni
1.847
-0.281
-13.2%
1 gen 2014 anni
1.973
+0.127
6.85%
1 gen 2015 anni
2.125
+0.152
7.71%
Classificazione dei paesi secondo i statistiche attuali per anni
