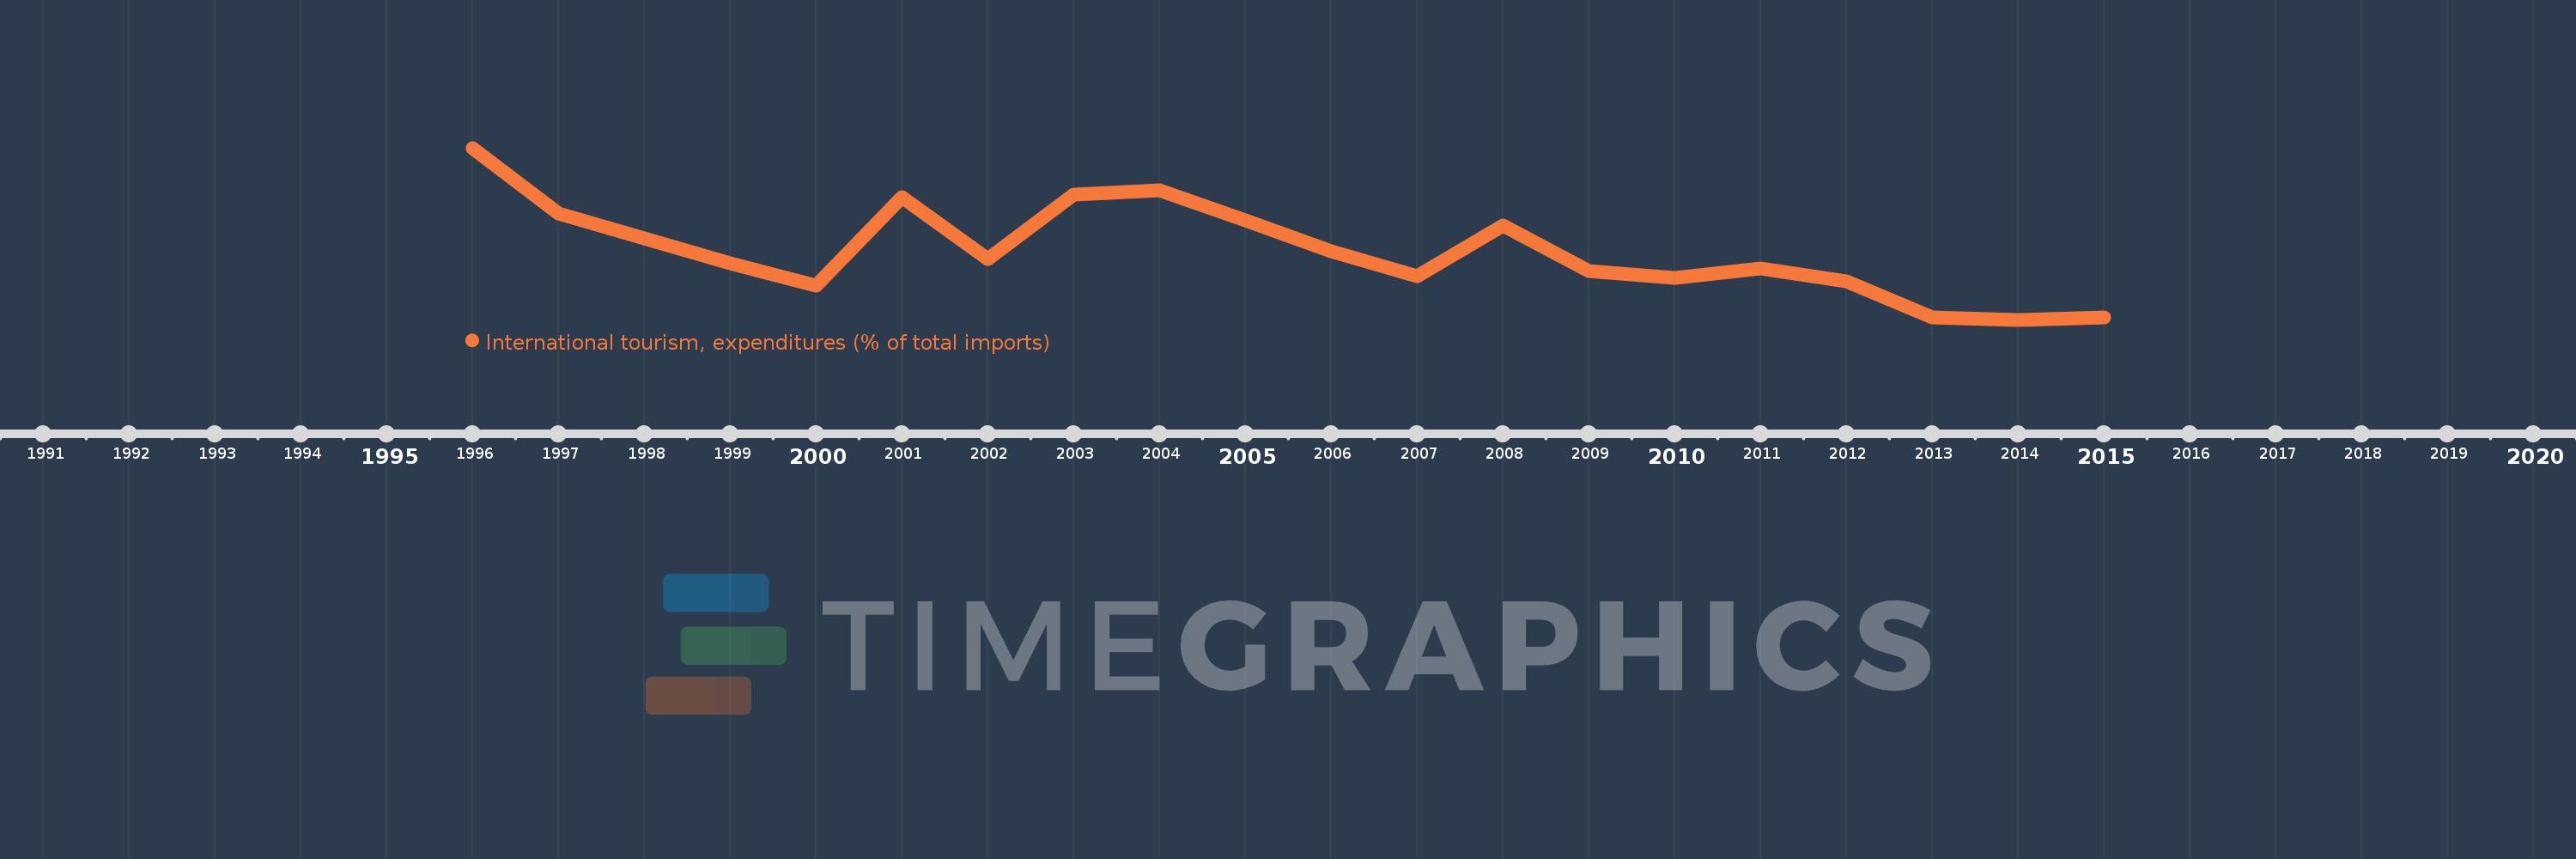
Questa scala temporale mostra un grafico dal 1996 anno al 2015 anno. Seychelles. I dati fino ad 1995 anno non disponibili. Il numero di osservazioni attuali secondo i date: 20.
La fonte (nome):
Indicatori dello sviluppo mondiale
La fonte (organizzazione):
World Tourism Organization, Yearbook of Tourism Statistics, Compendium of Tourism Statistics and data files, and IMF and World Bank imports estimates.
Categorie:
Private Sector, Trade
sono stati aggiornati
23 apr 2017 anni
Indicatori delle variazioni dei valori per anni
In media:
6.693
Minima:
4.008
1 gen 2014 anni
Massimo:
10.701
1 gen 1996 anni
Alla data di osservazione
Valore
Variazione assoluta
La variazione rispetto al valore precedente
1 gen 1996 anni
10.701
+10.701
0.0%
1 gen 1997 anni
8.135
-2.565
-23.97%
1 gen 1998 anni
7.191
-0.945
-11.61%
1 gen 1999 anni
6.212
-0.978
-13.6%
1 gen 2000 anni
5.326
-0.887
-14.27%
1 gen 2001 anni
8.768
+3.442
64.63%
1 gen 2002 anni
6.364
-2.403
-27.41%
1 gen 2003 anni
8.88
+2.516
39.53%
1 gen 2004 anni
9.064
+0.183
2.07%
1 gen 2005 anni
7.886
-1.178
-13.0%
1 gen 2006 anni
6.667
-1.218
-15.45%
1 gen 2007 anni
5.688
-0.979
-14.69%
1 gen 2008 anni
7.695
+2.007
35.28%
1 gen 2009 anni
5.902
-1.793
-23.3%
1 gen 2010 anni
5.648
-0.254
-4.31%
1 gen 2011 anni
6.013
+0.365
6.47%
1 gen 2012 anni
5.504
-0.509
-8.46%
1 gen 2013 anni
4.099
-1.405
-25.53%
1 gen 2014 anni
4.008
-0.091
-2.21%
1 gen 2015 anni
4.103
+0.095
2.38%
Classificazione dei paesi secondo i statistiche attuali per anni
