29
/it/
it
AIzaSyAYiBZKx7MnpbEhh9jyipgxe19OcubqV5w
April 1, 2024
72874
Australia
AUS
true
2
1
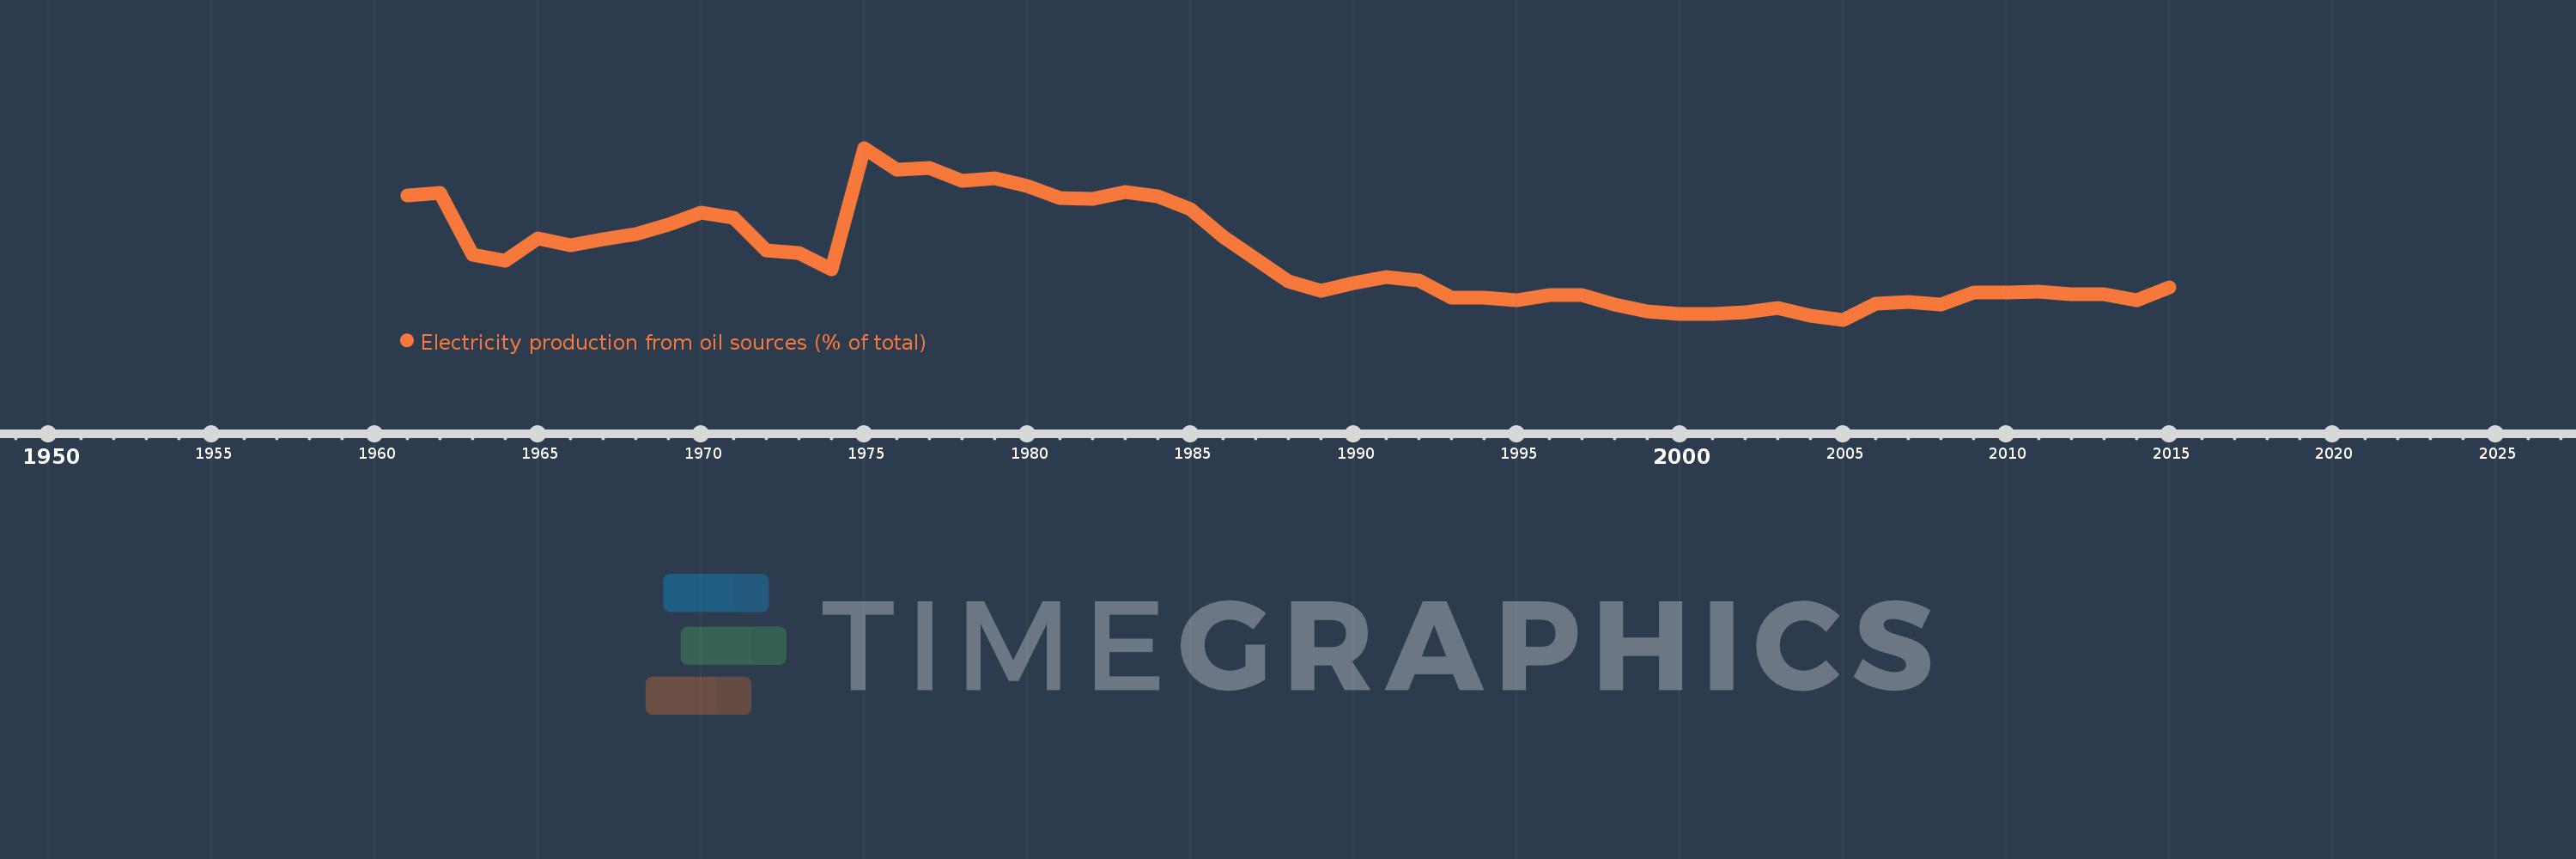
Electricity production from oil sources (% of total)
2015,2014,2013,2012,2011,2010,2009,2008,2007,2006,2005,2004,2003,2002,2001,2000,1999,1998,1997,1996,1995,1994,1993,1992,1991,1990,1989,1988,1987,1986,1985,1984,1983,1982,1981,1980,1979,1978,1977,1976,1975,1974,1973,1972,1971,1970,1969,1968,1967,1966,1965,1964,1963,1962,1961
Queste statistiche in altri paesi:
AlbaniaAlgeriaAngolaArab WorldArgentinaArmeniaAustraliaAustriaAzerbaijanBahrainBangladeshBelarusBelgiumBeninBoliviaBosnia and HerzegovinaBotswanaBrazilBrunei DarussalamBulgariaCambodiaCameroonCanadaCentral Europe and the BalticsChileChinaColombiaCongo, Dem. Rep.Congo, Rep.Costa RicaCote d'IvoireCroatiaCubaCuracaoCyprusCzech RepublicDenmarkDominican RepublicEarly-demographic dividendEast Asia & PacificEast Asia & Pacific (excluding high income)East Asia & Pacific (IDA & IBRD countries)EcuadorEgypt, Arab Rep.El SalvadorEritreaEstoniaEthiopiaEuro areaEurope & Central AsiaEurope & Central Asia (excluding high income)Europe & Central Asia (IDA & IBRD countries)European UnionFinlandFragile and conflict affected situationsFranceGabonGeorgiaGermanyGhanaGibraltarGreeceGuatemalaHaitiHeavily indebted poor countries (HIPC)High incomeHondurasHong Kong SAR, ChinaHungaryIBRD onlyIcelandIDA & IBRD totalIDA blendIDA onlyIDA totalIndiaIndonesiaIran, Islamic Rep.IraqIrelandIsraelItalyJamaicaJapanJordanKazakhstanKenyaKorea, Dem. People’s Rep.Korea, Rep.KosovoKuwaitKyrgyz RepublicLate-demographic dividendLatin America & Caribbean Latin America & Caribbean (excluding high income)Latin America & the Caribbean (IDA & IBRD countries)LatviaLeast developed countries: UN classificationLebanonLibyaLithuaniaLow & middle incomeLower middle incomeLuxembourgMacedonia, FYRMalaysiaMaltaMauritiusMexicoMiddle East & North AfricaMiddle East & North Africa (excluding high income)Middle East & North Africa (IDA & IBRD countries)Middle incomeMoldovaMongoliaMontenegroMoroccoMozambiqueMyanmarNamibiaNepalNetherlandsNew ZealandNicaraguaNigerNigeriaNorth AmericaNorwayOECD membersOmanOther small statesPakistanPanamaParaguayPeruPhilippinesPolandPortugalPost-demographic dividendPre-demographic dividendQatarRomaniaRussian FederationSaudi ArabiaSenegalSerbiaSingaporeSlovak RepublicSloveniaSmall statesSouth AfricaSouth AsiaSouth Asia (IDA & IBRD)South SudanSpainSri LankaSub-Saharan Africa Sub-Saharan Africa (excluding high income)Sub-Saharan Africa (IDA & IBRD countries)SudanSwedenSwitzerlandSyrian Arab RepublicTajikistanTanzaniaThailandTogoTrinidad and TobagoTunisiaTurkeyTurkmenistanUkraineUnited Arab EmiratesUnited KingdomUnited StatesUpper middle incomeUruguayUzbekistanVenezuela, RBVietnamWorldYemen, Rep.ZambiaZimbabwe Linea del tempo:
Questa scala temporale mostra un grafico dal 1961 anno al 2015 anno. Australia. I dati fino ad 1960 anno non disponibili. Il numero di osservazioni attuali secondo i date: 55.
La fonte (nome):
Indicatori dello sviluppo mondiale
La fonte (organizzazione):
IEA Statistics © OECD/IEA 2014 (http://www.iea.org/stats/index.asp), subject to https://www.iea.org/t&c/termsandconditions/
Categorie:
Energy & Mining, Climate Change, Infrastructure
sono stati aggiornati
23 apr 2017 anni
Indicatori delle variazioni dei valori per anni
Minima:
0.605
1 gen 2005 anni
Massimo:
7.418
1 gen 1975 anni
Alla data di osservazione
Valore
Variazione assoluta
La variazione rispetto al valore precedente
1 gen 1961 anni
5.525
+5.525
0.0%
1 gen 1962 anni
5.647
+0.122
2.21%
1 gen 1963 anni
3.181
-2.465
-43.66%
1 gen 1964 anni
2.929
-0.253
-7.95%
1 gen 1965 anni
3.839
+0.91
31.08%
1 gen 1966 anni
3.562
-0.276
-7.2%
1 gen 1967 anni
3.791
+0.229
6.43%
1 gen 1968 anni
3.985
+0.193
5.1%
1 gen 1969 anni
4.372
+0.388
9.73%
1 gen 1970 anni
4.868
+0.495
11.33%
1 gen 1971 anni
4.639
-0.228
-4.69%
1 gen 1972 anni
3.371
-1.269
-27.35%
1 gen 1973 anni
3.267
-0.104
-3.07%
1 gen 1974 anni
2.605
-0.662
-20.26%
1 gen 1975 anni
7.418
+4.813
184.74%
1 gen 1976 anni
6.555
-0.863
-11.63%
1 gen 1977 anni
6.628
+0.073
1.11%
1 gen 1978 anni
6.11
-0.518
-7.81%
1 gen 1979 anni
6.21
+0.1
1.64%
1 gen 1980 anni
5.9
-0.31
-4.99%
1 gen 1981 anni
5.428
-0.472
-8.01%
1 gen 1982 anni
5.392
-0.036
-0.66%
1 gen 1983 anni
5.676
+0.284
5.26%
1 gen 1984 anni
5.487
-0.188
-3.32%
1 gen 1985 anni
4.983
-0.504
-9.19%
1 gen 1986 anni
3.9
-1.083
-21.73%
1 gen 1987 anni
3.008
-0.892
-22.88%
1 gen 1988 anni
2.128
-0.88
-29.25%
1 gen 1989 anni
1.767
-0.361
-16.96%
1 gen 1990 anni
2.056
+0.289
16.34%
1 gen 1991 anni
2.302
+0.246
11.98%
1 gen 1992 anni
2.169
-0.133
-5.77%
1 gen 1993 anni
1.484
-0.685
-31.58%
1 gen 1994 anni
1.483
-0.001
-0.08%
1 gen 1995 anni
1.388
-0.095
-6.43%
1 gen 1996 anni
1.584
+0.197
14.17%
1 gen 1997 anni
1.582
-0.002
-0.14%
1 gen 1998 anni
1.191
-0.391
-24.72%
1 gen 1999 anni
0.934
-0.257
-21.61%
1 gen 2000 anni
0.849
-0.085
-9.07%
1 gen 2001 anni
0.85
+0.001
0.11%
1 gen 2002 anni
0.911
+0.061
7.22%
1 gen 2003 anni
1.076
+0.164
18.03%
1 gen 2004 anni
0.749
-0.327
-30.42%
1 gen 2005 anni
0.605
-0.143
-19.17%
1 gen 2006 anni
1.244
+0.639
105.62%
1 gen 2007 anni
1.314
+0.07
5.61%
1 gen 2008 anni
1.191
-0.123
-9.39%
1 gen 2009 anni
1.669
+0.479
40.22%
1 gen 2010 anni
1.685
+0.015
0.92%
1 gen 2011 anni
1.728
+0.043
2.54%
1 gen 2012 anni
1.62
-0.108
-6.22%
1 gen 2013 anni
1.628
+0.008
0.48%
1 gen 2014 anni
1.37
-0.258
-15.86%
1 gen 2015 anni
1.887
+0.517
37.76%
Classificazione dei paesi secondo i statistiche attuali per anni


Commenti: