29
/it/
it
AIzaSyAYiBZKx7MnpbEhh9jyipgxe19OcubqV5w
April 1, 2024
118807
Denmark
DNK
true
2
1
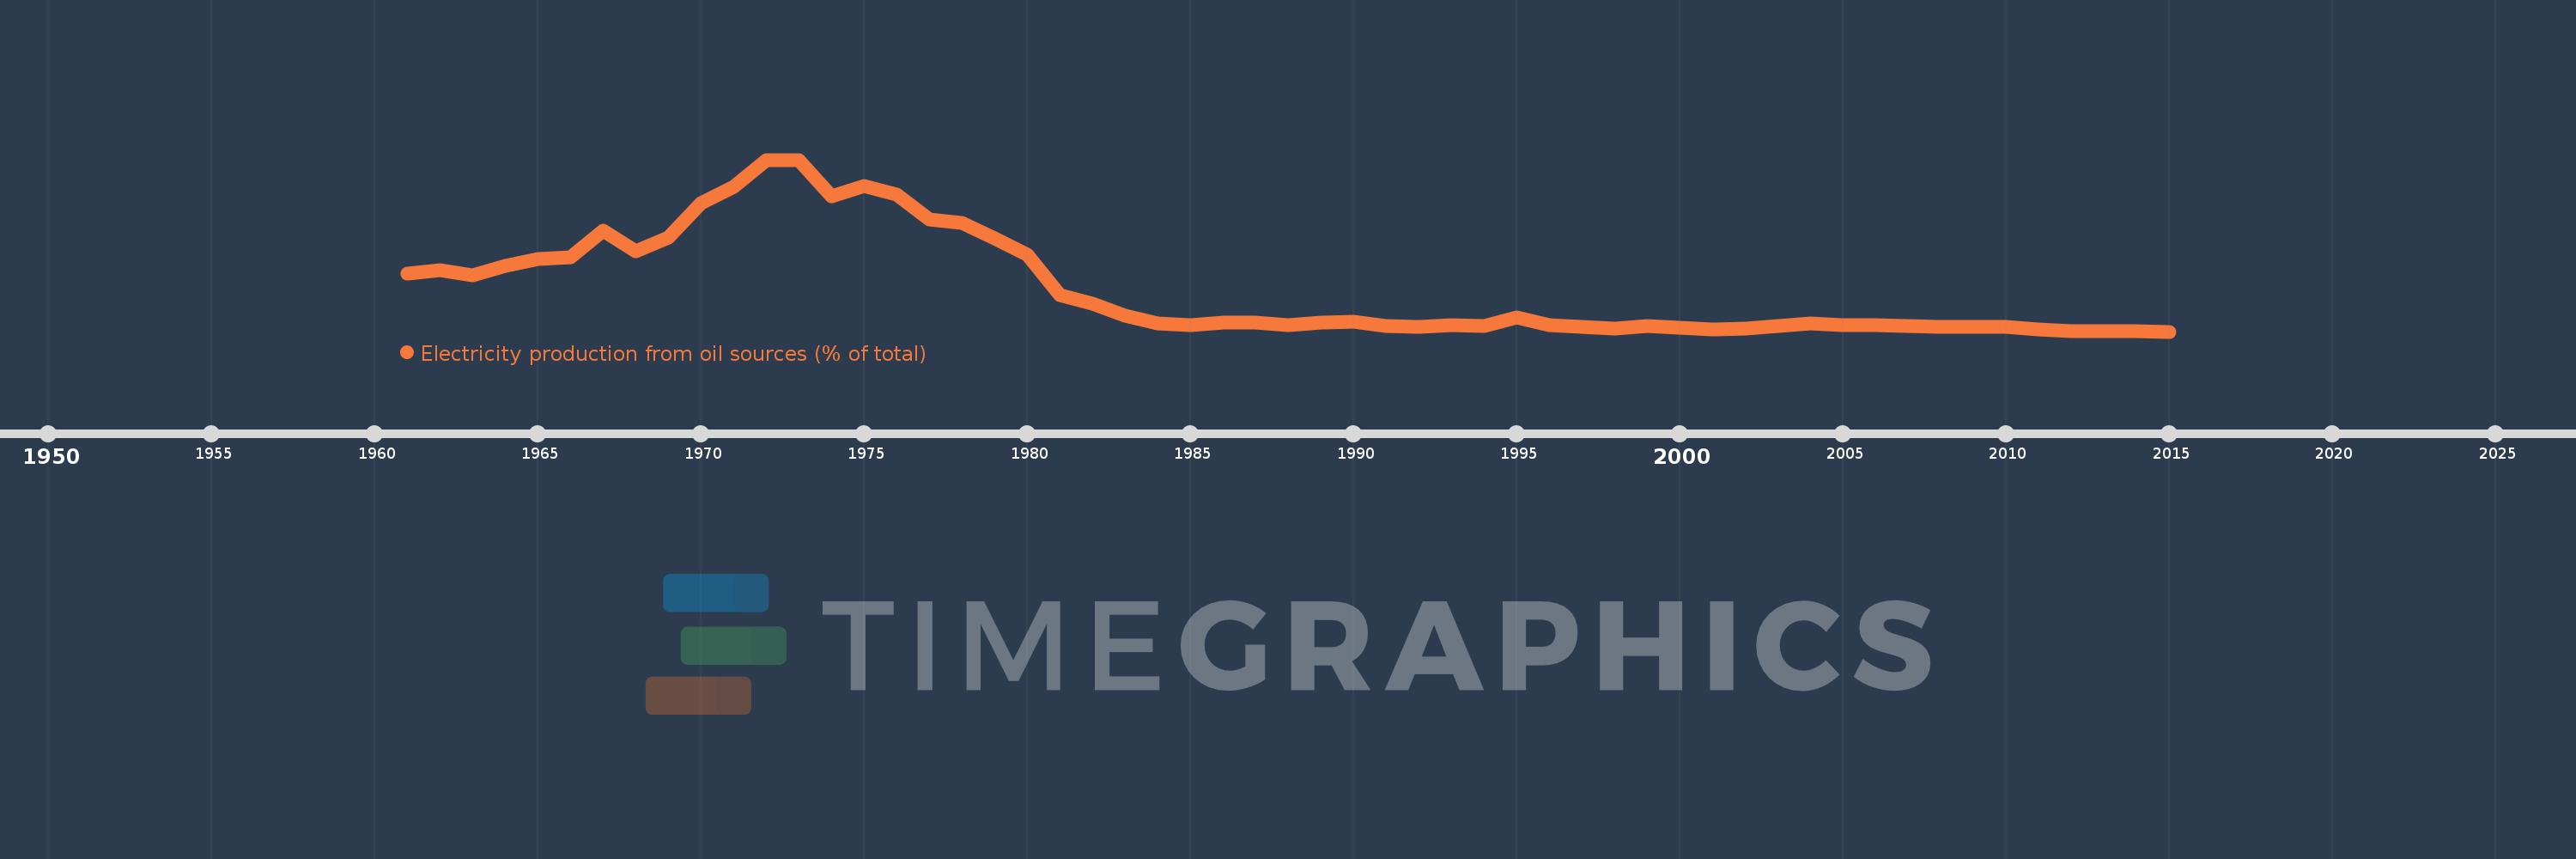
Electricity production from oil sources (% of total)
2015,2014,2013,2012,2011,2010,2009,2008,2007,2006,2005,2004,2003,2002,2001,2000,1999,1998,1997,1996,1995,1994,1993,1992,1991,1990,1989,1988,1987,1986,1985,1984,1983,1982,1981,1980,1979,1978,1977,1976,1975,1974,1973,1972,1971,1970,1969,1968,1967,1966,1965,1964,1963,1962,1961
Queste statistiche in altri paesi:
AlbaniaAlgeriaAngolaArab WorldArgentinaArmeniaAustraliaAustriaAzerbaijanBahrainBangladeshBelarusBelgiumBeninBoliviaBosnia and HerzegovinaBotswanaBrazilBrunei DarussalamBulgariaCambodiaCameroonCanadaCentral Europe and the BalticsChileChinaColombiaCongo, Dem. Rep.Congo, Rep.Costa RicaCote d'IvoireCroatiaCubaCuracaoCyprusCzech RepublicDenmarkDominican RepublicEarly-demographic dividendEast Asia & PacificEast Asia & Pacific (excluding high income)East Asia & Pacific (IDA & IBRD countries)EcuadorEgypt, Arab Rep.El SalvadorEritreaEstoniaEthiopiaEuro areaEurope & Central AsiaEurope & Central Asia (excluding high income)Europe & Central Asia (IDA & IBRD countries)European UnionFinlandFragile and conflict affected situationsFranceGabonGeorgiaGermanyGhanaGibraltarGreeceGuatemalaHaitiHeavily indebted poor countries (HIPC)High incomeHondurasHong Kong SAR, ChinaHungaryIBRD onlyIcelandIDA & IBRD totalIDA blendIDA onlyIDA totalIndiaIndonesiaIran, Islamic Rep.IraqIrelandIsraelItalyJamaicaJapanJordanKazakhstanKenyaKorea, Dem. People’s Rep.Korea, Rep.KosovoKuwaitKyrgyz RepublicLate-demographic dividendLatin America & Caribbean Latin America & Caribbean (excluding high income)Latin America & the Caribbean (IDA & IBRD countries)LatviaLeast developed countries: UN classificationLebanonLibyaLithuaniaLow & middle incomeLower middle incomeLuxembourgMacedonia, FYRMalaysiaMaltaMauritiusMexicoMiddle East & North AfricaMiddle East & North Africa (excluding high income)Middle East & North Africa (IDA & IBRD countries)Middle incomeMoldovaMongoliaMontenegroMoroccoMozambiqueMyanmarNamibiaNepalNetherlandsNew ZealandNicaraguaNigerNigeriaNorth AmericaNorwayOECD membersOmanOther small statesPakistanPanamaParaguayPeruPhilippinesPolandPortugalPost-demographic dividendPre-demographic dividendQatarRomaniaRussian FederationSaudi ArabiaSenegalSerbiaSingaporeSlovak RepublicSloveniaSmall statesSouth AfricaSouth AsiaSouth Asia (IDA & IBRD)South SudanSpainSri LankaSub-Saharan Africa Sub-Saharan Africa (excluding high income)Sub-Saharan Africa (IDA & IBRD countries)SudanSwedenSwitzerlandSyrian Arab RepublicTajikistanTanzaniaThailandTogoTrinidad and TobagoTunisiaTurkeyTurkmenistanUkraineUnited Arab EmiratesUnited KingdomUnited StatesUpper middle incomeUruguayUzbekistanVenezuela, RBVietnamWorldYemen, Rep.ZambiaZimbabwe Linea del tempo:
Questa scala temporale mostra un grafico dal 1961 anno al 2015 anno. Denmark. I dati fino ad 1960 anno non disponibili. Il numero di osservazioni attuali secondo i date: 55.
La fonte (nome):
Indicatori dello sviluppo mondiale
La fonte (organizzazione):
IEA Statistics © OECD/IEA 2014 (http://www.iea.org/stats/index.asp), subject to https://www.iea.org/t&c/termsandconditions/
Categorie:
Energy & Mining, Climate Change, Infrastructure
sono stati aggiornati
23 apr 2017 anni
Indicatori delle variazioni dei valori per anni
Minima:
0.925
1 gen 2015 anni
Massimo:
81.277
1 gen 1972 anni
Alla data di osservazione
Valore
Variazione assoluta
La variazione rispetto al valore precedente
1 gen 1961 anni
27.924
+27.924
0.0%
1 gen 1962 anni
29.646
+1.722
6.17%
1 gen 1963 anni
27.279
-2.368
-7.99%
1 gen 1964 anni
31.505
+4.226
15.49%
1 gen 1965 anni
34.844
+3.339
10.6%
1 gen 1966 anni
35.711
+0.866
2.49%
1 gen 1967 anni
48.328
+12.617
35.33%
1 gen 1968 anni
38.316
-10.012
-20.72%
1 gen 1969 anni
45.109
+6.793
17.73%
1 gen 1970 anni
61.096
+15.987
35.44%
1 gen 1971 anni
68.673
+7.577
12.4%
1 gen 1972 anni
81.277
+12.604
18.35%
1 gen 1973 anni
81.132
-0.145
-0.18%
1 gen 1974 anni
64.074
-17.057
-21.02%
1 gen 1975 anni
69.016
+4.942
7.71%
1 gen 1976 anni
64.92
-4.096
-5.93%
1 gen 1977 anni
53.406
-11.514
-17.74%
1 gen 1978 anni
51.885
-1.52
-2.85%
1 gen 1979 anni
44.48
-7.405
-14.27%
1 gen 1980 anni
36.742
-7.738
-17.4%
1 gen 1981 anni
18.005
-18.737
-51.0%
1 gen 1982 anni
13.783
-4.222
-23.45%
1 gen 1983 anni
8.337
-5.446
-39.52%
1 gen 1984 anni
4.594
-3.742
-44.89%
1 gen 1985 anni
3.745
-0.85
-18.49%
1 gen 1986 anni
5.027
+1.282
34.24%
1 gen 1987 anni
5.006
-0.021
-0.41%
1 gen 1988 anni
4.035
-0.971
-19.39%
1 gen 1989 anni
5.183
+1.148
28.45%
1 gen 1990 anni
5.359
+0.176
3.39%
1 gen 1991 anni
3.395
-1.964
-36.66%
1 gen 1992 anni
3.147
-0.248
-7.3%
1 gen 1993 anni
4.015
+0.868
27.58%
1 gen 1994 anni
3.726
-0.288
-7.18%
1 gen 1995 anni
7.474
+3.748
100.58%
1 gen 1996 anni
3.871
-3.603
-48.21%
1 gen 1997 anni
3.281
-0.59
-15.25%
1 gen 1998 anni
2.214
-1.067
-32.53%
1 gen 1999 anni
3.396
+1.182
53.39%
1 gen 2000 anni
2.826
-0.569
-16.76%
1 gen 2001 anni
1.936
-0.89
-31.5%
1 gen 2002 anni
2.319
+0.383
19.79%
1 gen 2003 anni
3.683
+1.364
58.81%
1 gen 2004 anni
4.62
+0.937
25.45%
1 gen 2005 anni
4.046
-0.575
-12.43%
1 gen 2006 anni
3.794
-0.252
-6.24%
1 gen 2007 anni
3.55
-0.244
-6.43%
1 gen 2008 anni
3.276
-0.274
-7.71%
1 gen 2009 anni
3.062
-0.215
-6.55%
1 gen 2010 anni
3.216
+0.154
5.04%
1 gen 2011 anni
1.992
-1.224
-38.07%
1 gen 2012 anni
1.286
-0.706
-35.44%
1 gen 2013 anni
1.312
+0.026
2.0%
1 gen 2014 anni
1.013
-0.299
-22.77%
1 gen 2015 anni
0.925
-0.088
-8.72%
Classificazione dei paesi secondo i statistiche attuali per anni


Commenti: