29
/it/
it
AIzaSyAYiBZKx7MnpbEhh9jyipgxe19OcubqV5w
April 1, 2024
159302
Ireland
IRL
true
2
1
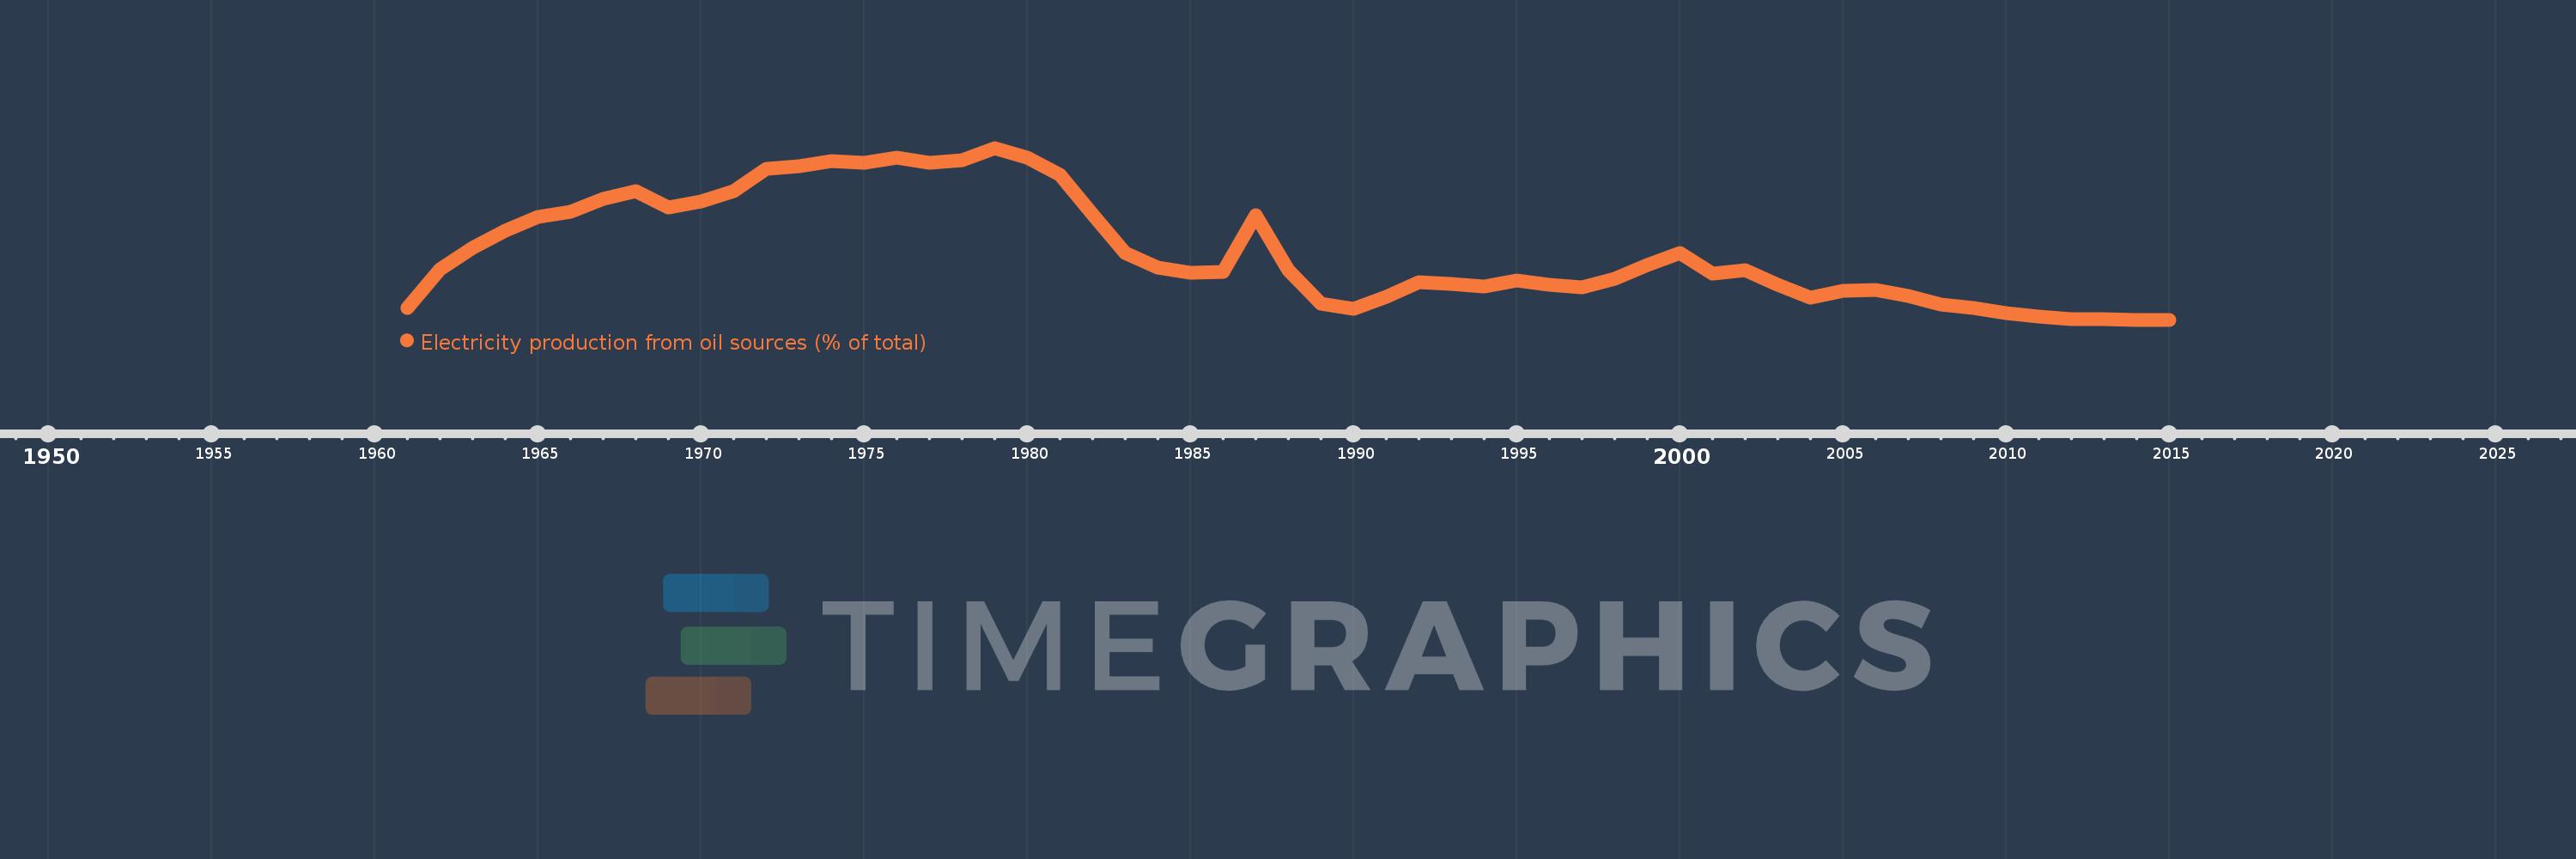
Electricity production from oil sources (% of total)
2015,2014,2013,2012,2011,2010,2009,2008,2007,2006,2005,2004,2003,2002,2001,2000,1999,1998,1997,1996,1995,1994,1993,1992,1991,1990,1989,1988,1987,1986,1985,1984,1983,1982,1981,1980,1979,1978,1977,1976,1975,1974,1973,1972,1971,1970,1969,1968,1967,1966,1965,1964,1963,1962,1961
Queste statistiche in altri paesi:
AlbaniaAlgeriaAngolaArab WorldArgentinaArmeniaAustraliaAustriaAzerbaijanBahrainBangladeshBelarusBelgiumBeninBoliviaBosnia and HerzegovinaBotswanaBrazilBrunei DarussalamBulgariaCambodiaCameroonCanadaCentral Europe and the BalticsChileChinaColombiaCongo, Dem. Rep.Congo, Rep.Costa RicaCote d'IvoireCroatiaCubaCuracaoCyprusCzech RepublicDenmarkDominican RepublicEarly-demographic dividendEast Asia & PacificEast Asia & Pacific (excluding high income)East Asia & Pacific (IDA & IBRD countries)EcuadorEgypt, Arab Rep.El SalvadorEritreaEstoniaEthiopiaEuro areaEurope & Central AsiaEurope & Central Asia (excluding high income)Europe & Central Asia (IDA & IBRD countries)European UnionFinlandFragile and conflict affected situationsFranceGabonGeorgiaGermanyGhanaGibraltarGreeceGuatemalaHaitiHeavily indebted poor countries (HIPC)High incomeHondurasHong Kong SAR, ChinaHungaryIBRD onlyIcelandIDA & IBRD totalIDA blendIDA onlyIDA totalIndiaIndonesiaIran, Islamic Rep.IraqIrelandIsraelItalyJamaicaJapanJordanKazakhstanKenyaKorea, Dem. People’s Rep.Korea, Rep.KosovoKuwaitKyrgyz RepublicLate-demographic dividendLatin America & Caribbean Latin America & Caribbean (excluding high income)Latin America & the Caribbean (IDA & IBRD countries)LatviaLeast developed countries: UN classificationLebanonLibyaLithuaniaLow & middle incomeLower middle incomeLuxembourgMacedonia, FYRMalaysiaMaltaMauritiusMexicoMiddle East & North AfricaMiddle East & North Africa (excluding high income)Middle East & North Africa (IDA & IBRD countries)Middle incomeMoldovaMongoliaMontenegroMoroccoMozambiqueMyanmarNamibiaNepalNetherlandsNew ZealandNicaraguaNigerNigeriaNorth AmericaNorwayOECD membersOmanOther small statesPakistanPanamaParaguayPeruPhilippinesPolandPortugalPost-demographic dividendPre-demographic dividendQatarRomaniaRussian FederationSaudi ArabiaSenegalSerbiaSingaporeSlovak RepublicSloveniaSmall statesSouth AfricaSouth AsiaSouth Asia (IDA & IBRD)South SudanSpainSri LankaSub-Saharan Africa Sub-Saharan Africa (excluding high income)Sub-Saharan Africa (IDA & IBRD countries)SudanSwedenSwitzerlandSyrian Arab RepublicTajikistanTanzaniaThailandTogoTrinidad and TobagoTunisiaTurkeyTurkmenistanUkraineUnited Arab EmiratesUnited KingdomUnited StatesUpper middle incomeUruguayUzbekistanVenezuela, RBVietnamWorldYemen, Rep.ZambiaZimbabwe Linea del tempo:
Questa scala temporale mostra un grafico dal 1961 anno al 2015 anno. Ireland. I dati fino ad 1960 anno non disponibili. Il numero di osservazioni attuali secondo i date: 55.
La fonte (nome):
Indicatori dello sviluppo mondiale
La fonte (organizzazione):
IEA Statistics © OECD/IEA 2014 (http://www.iea.org/stats/index.asp), subject to https://www.iea.org/t&c/termsandconditions/
Categorie:
Energy & Mining, Climate Change, Infrastructure
sono stati aggiornati
23 apr 2017 anni
Indicatori delle variazioni dei valori per anni
Minima:
0.724
1 gen 2015 anni
Massimo:
71.636
1 gen 1979 anni
Alla data di osservazione
Valore
Variazione assoluta
La variazione rispetto al valore precedente
1 gen 1961 anni
5.482
+5.482
0.0%
1 gen 1962 anni
21.443
+15.961
291.16%
1 gen 1963 anni
30.571
+9.128
42.57%
1 gen 1964 anni
37.526
+6.955
22.75%
1 gen 1965 anni
43.275
+5.749
15.32%
1 gen 1966 anni
45.462
+2.187
5.05%
1 gen 1967 anni
50.562
+5.1
11.22%
1 gen 1968 anni
53.846
+3.284
6.5%
1 gen 1969 anni
47.008
-6.838
-12.7%
1 gen 1970 anni
49.687
+2.679
5.7%
1 gen 1971 anni
53.79
+4.104
8.26%
1 gen 1972 anni
62.865
+9.074
16.87%
1 gen 1973 anni
64.131
+1.266
2.01%
1 gen 1974 anni
66.317
+2.186
3.41%
1 gen 1975 anni
65.614
-0.703
-1.06%
1 gen 1976 anni
67.784
+2.17
3.31%
1 gen 1977 anni
65.503
-2.28
-3.36%
1 gen 1978 anni
66.722
+1.219
1.86%
1 gen 1979 anni
71.636
+4.914
7.36%
1 gen 1980 anni
67.782
-3.854
-5.38%
1 gen 1981 anni
60.43
-7.352
-10.85%
1 gen 1982 anni
44.116
-16.313
-27.0%
1 gen 1983 anni
28.443
-15.674
-35.53%
1 gen 1984 anni
22.19
-6.252
-21.98%
1 gen 1985 anni
20.078
-2.112
-9.52%
1 gen 1986 anni
20.646
+0.567
2.83%
1 gen 1987 anni
43.699
+23.053
111.66%
1 gen 1988 anni
21.316
-22.383
-51.22%
1 gen 1989 anni
7.522
-13.794
-64.71%
1 gen 1990 anni
5.29
-2.232
-29.67%
1 gen 1991 anni
10.036
+4.745
89.7%
1 gen 1992 anni
16.289
+6.254
62.31%
1 gen 1993 anni
15.665
-0.624
-3.83%
1 gen 1994 anni
14.496
-1.169
-7.46%
1 gen 1995 anni
16.853
+2.357
16.26%
1 gen 1996 anni
15.224
-1.629
-9.67%
1 gen 1997 anni
14.202
-1.022
-6.71%
1 gen 1998 anni
17.599
+3.397
23.92%
1 gen 1999 anni
23.225
+5.627
31.97%
1 gen 2000 anni
28.344
+5.118
22.04%
1 gen 2001 anni
19.592
-8.752
-30.88%
1 gen 2002 anni
21.123
+1.531
7.81%
1 gen 2003 anni
15.01
-6.113
-28.94%
1 gen 2004 anni
9.871
-5.139
-34.24%
1 gen 2005 anni
12.734
+2.864
29.01%
1 gen 2006 anni
13.034
+0.299
2.35%
1 gen 2007 anni
10.451
-2.582
-19.81%
1 gen 2008 anni
6.891
-3.561
-34.07%
1 gen 2009 anni
5.714
-1.177
-17.07%
1 gen 2010 anni
3.294
-2.42
-42.35%
1 gen 2011 anni
2.128
-1.166
-35.39%
1 gen 2012 anni
0.874
-1.255
-58.95%
1 gen 2013 anni
0.909
+0.036
4.08%
1 gen 2014 anni
0.78
-0.13
-14.24%
1 gen 2015 anni
0.724
-0.056
-7.17%
Classificazione dei paesi secondo i statistiche attuali per anni


Commenti: