29
/it/
it
AIzaSyAYiBZKx7MnpbEhh9jyipgxe19OcubqV5w
April 1, 2024
162437
Jamaica
JAM
true
2
1
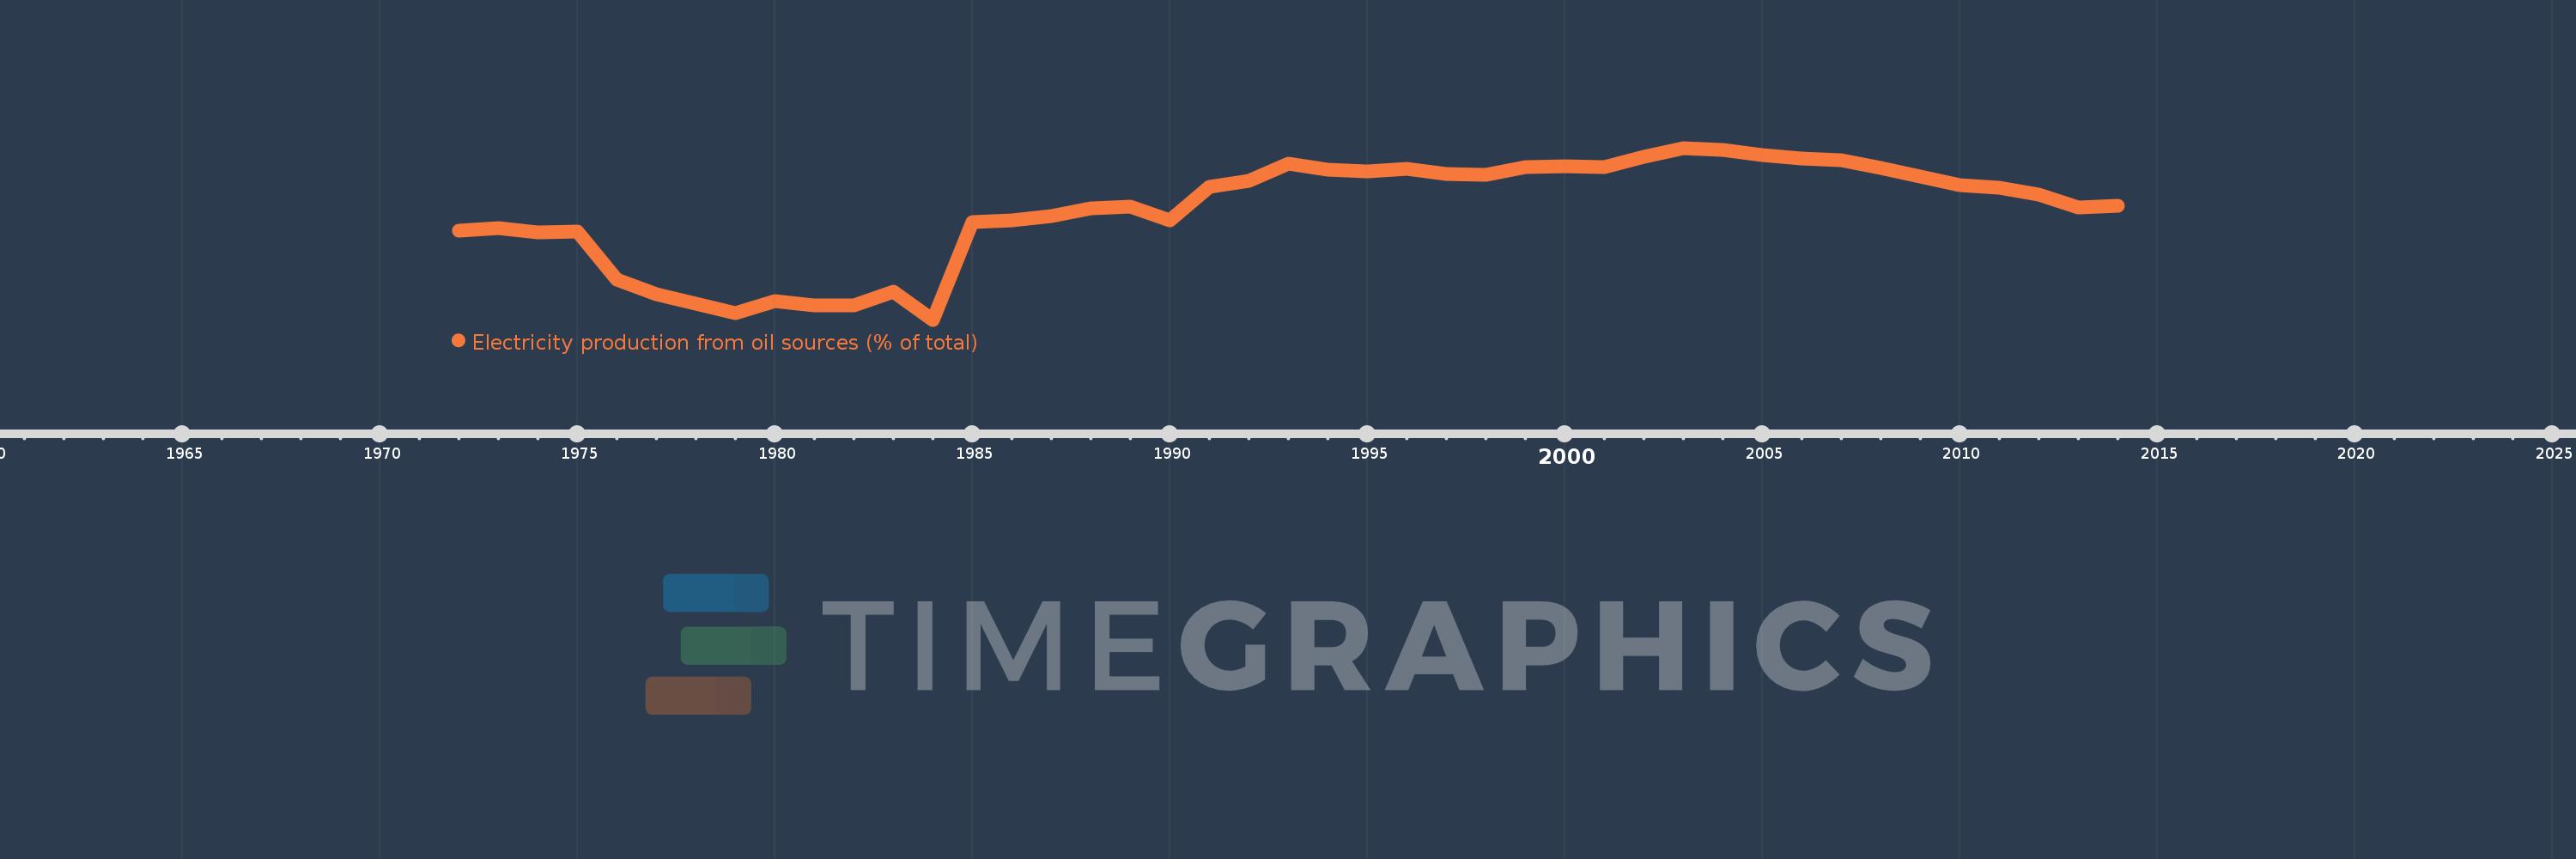
Electricity production from oil sources (% of total)
2014,2013,2012,2011,2010,2009,2008,2007,2006,2005,2004,2003,2002,2001,2000,1999,1998,1997,1996,1995,1994,1993,1992,1991,1990,1989,1988,1987,1986,1985,1984,1983,1982,1981,1980,1979,1978,1977,1976,1975,1974,1973,1972
Queste statistiche in altri paesi:
AlbaniaAlgeriaAngolaArab WorldArgentinaArmeniaAustraliaAustriaAzerbaijanBahrainBangladeshBelarusBelgiumBeninBoliviaBosnia and HerzegovinaBotswanaBrazilBrunei DarussalamBulgariaCambodiaCameroonCanadaCentral Europe and the BalticsChileChinaColombiaCongo, Dem. Rep.Congo, Rep.Costa RicaCote d'IvoireCroatiaCubaCuracaoCyprusCzech RepublicDenmarkDominican RepublicEarly-demographic dividendEast Asia & PacificEast Asia & Pacific (excluding high income)East Asia & Pacific (IDA & IBRD countries)EcuadorEgypt, Arab Rep.El SalvadorEritreaEstoniaEthiopiaEuro areaEurope & Central AsiaEurope & Central Asia (excluding high income)Europe & Central Asia (IDA & IBRD countries)European UnionFinlandFragile and conflict affected situationsFranceGabonGeorgiaGermanyGhanaGibraltarGreeceGuatemalaHaitiHeavily indebted poor countries (HIPC)High incomeHondurasHong Kong SAR, ChinaHungaryIBRD onlyIcelandIDA & IBRD totalIDA blendIDA onlyIDA totalIndiaIndonesiaIran, Islamic Rep.IraqIrelandIsraelItalyJamaicaJapanJordanKazakhstanKenyaKorea, Dem. People’s Rep.Korea, Rep.KosovoKuwaitKyrgyz RepublicLate-demographic dividendLatin America & Caribbean Latin America & Caribbean (excluding high income)Latin America & the Caribbean (IDA & IBRD countries)LatviaLeast developed countries: UN classificationLebanonLibyaLithuaniaLow & middle incomeLower middle incomeLuxembourgMacedonia, FYRMalaysiaMaltaMauritiusMexicoMiddle East & North AfricaMiddle East & North Africa (excluding high income)Middle East & North Africa (IDA & IBRD countries)Middle incomeMoldovaMongoliaMontenegroMoroccoMozambiqueMyanmarNamibiaNepalNetherlandsNew ZealandNicaraguaNigerNigeriaNorth AmericaNorwayOECD membersOmanOther small statesPakistanPanamaParaguayPeruPhilippinesPolandPortugalPost-demographic dividendPre-demographic dividendQatarRomaniaRussian FederationSaudi ArabiaSenegalSerbiaSingaporeSlovak RepublicSloveniaSmall statesSouth AfricaSouth AsiaSouth Asia (IDA & IBRD)South SudanSpainSri LankaSub-Saharan Africa Sub-Saharan Africa (excluding high income)Sub-Saharan Africa (IDA & IBRD countries)SudanSwedenSwitzerlandSyrian Arab RepublicTajikistanTanzaniaThailandTogoTrinidad and TobagoTunisiaTurkeyTurkmenistanUkraineUnited Arab EmiratesUnited KingdomUnited StatesUpper middle incomeUruguayUzbekistanVenezuela, RBVietnamWorldYemen, Rep.ZambiaZimbabwe Linea del tempo:
Questa scala temporale mostra un grafico dal 1972 anno al 2014 anno. Jamaica. I dati fino ad 1971 anno non disponibili. Il numero di osservazioni attuali secondo i date: 43.
La fonte (nome):
Indicatori dello sviluppo mondiale
La fonte (organizzazione):
IEA Statistics © OECD/IEA 2014 (http://www.iea.org/stats/index.asp), subject to https://www.iea.org/t&c/termsandconditions/
Categorie:
Energy & Mining, Climate Change, Infrastructure
sono stati aggiornati
23 apr 2017 anni
Indicatori delle variazioni dei valori per anni
Minima:
74.048
1 gen 1984 anni
Massimo:
97.75
1 gen 2003 anni
Alla data di osservazione
Valore
Variazione assoluta
La variazione rispetto al valore precedente
1 gen 1972 anni
86.337
+86.337
0.0%
1 gen 1973 anni
86.64
+0.304
0.35%
1 gen 1974 anni
86.1
-0.541
-0.62%
1 gen 1975 anni
86.246
+0.146
0.17%
1 gen 1976 anni
79.594
-6.652
-7.71%
1 gen 1977 anni
77.595
-1.999
-2.51%
1 gen 1978 anni
76.281
-1.314
-1.69%
1 gen 1979 anni
74.902
-1.379
-1.81%
1 gen 1980 anni
76.673
+1.77
2.36%
1 gen 1981 anni
76.014
-0.658
-0.86%
1 gen 1982 anni
76.069
+0.055
0.07%
1 gen 1983 anni
77.97
+1.901
2.5%
1 gen 1984 anni
74.048
-3.922
-5.03%
1 gen 1985 anni
87.477
+13.429
18.14%
1 gen 1986 anni
87.775
+0.298
0.34%
1 gen 1987 anni
88.386
+0.611
0.7%
1 gen 1988 anni
89.434
+1.048
1.19%
1 gen 1989 anni
89.623
+0.189
0.21%
1 gen 1990 anni
87.798
-1.825
-2.04%
1 gen 1991 anni
92.433
+4.635
5.28%
1 gen 1992 anni
93.264
+0.831
0.9%
1 gen 1993 anni
95.524
+2.26
2.42%
1 gen 1994 anni
94.751
-0.773
-0.81%
1 gen 1995 anni
94.492
-0.259
-0.27%
1 gen 1996 anni
94.836
+0.344
0.36%
1 gen 1997 anni
94.121
-0.716
-0.75%
1 gen 1998 anni
94.069
-0.052
-0.06%
1 gen 1999 anni
95.077
+1.008
1.07%
1 gen 2000 anni
95.173
+0.096
0.1%
1 gen 2001 anni
95.156
-0.017
-0.02%
1 gen 2002 anni
96.544
+1.389
1.46%
1 gen 2003 anni
97.75
+1.206
1.25%
1 gen 2004 anni
97.481
-0.269
-0.28%
1 gen 2005 anni
96.716
-0.765
-0.78%
1 gen 2006 anni
96.308
-0.408
-0.42%
1 gen 2007 anni
96.052
-0.256
-0.27%
1 gen 2008 anni
95.03
-1.022
-1.06%
1 gen 2009 anni
93.861
-1.169
-1.23%
1 gen 2010 anni
92.633
-1.228
-1.31%
1 gen 2011 anni
92.315
-0.318
-0.34%
1 gen 2012 anni
91.273
-1.041
-1.13%
1 gen 2013 anni
89.541
-1.733
-1.9%
1 gen 2014 anni
89.771
+0.231
0.26%
Classificazione dei paesi secondo i statistiche attuali per anni


Commenti: