29
/it/
it
AIzaSyAYiBZKx7MnpbEhh9jyipgxe19OcubqV5w
April 1, 2024
257204
Switzerland
CHE
true
2
1
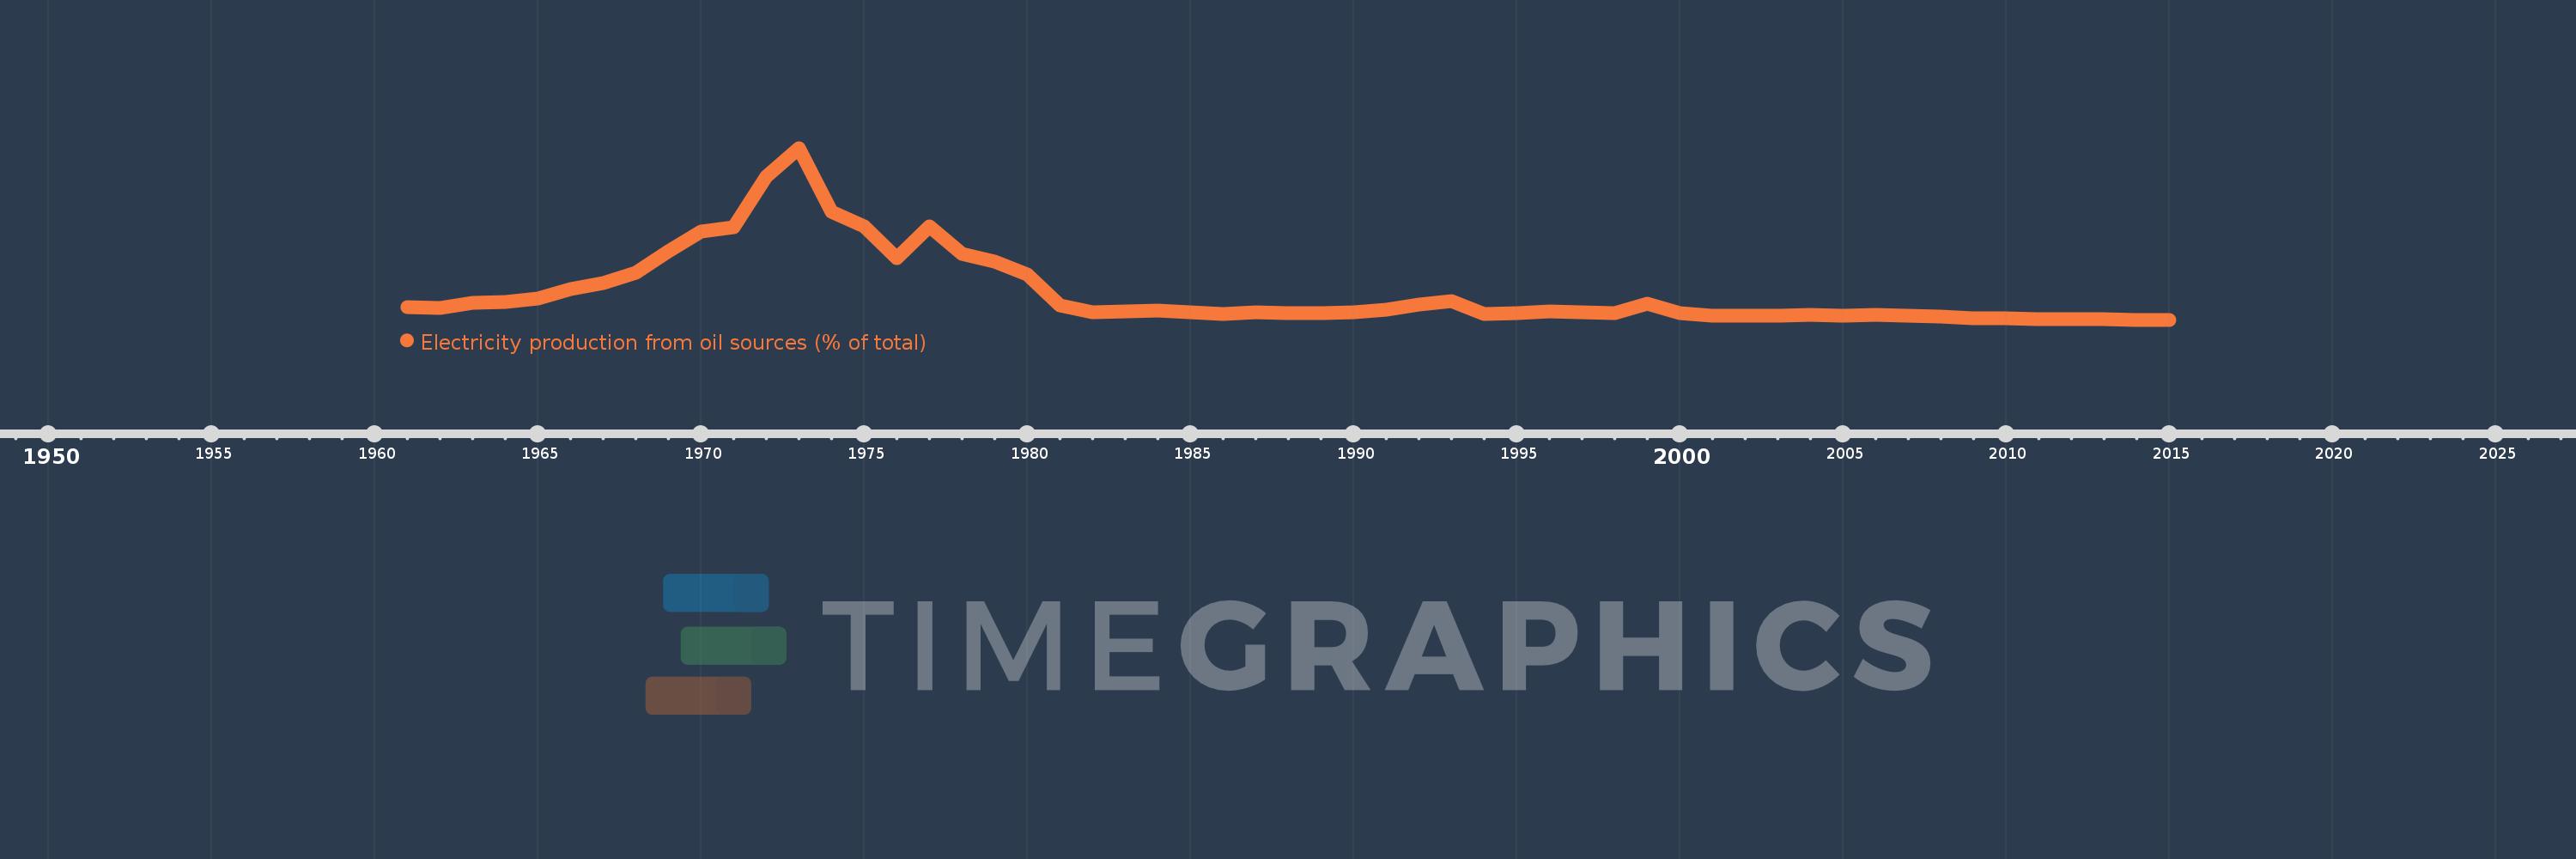
Electricity production from oil sources (% of total)
2015,2014,2013,2012,2011,2010,2009,2008,2007,2006,2005,2004,2003,2002,2001,2000,1999,1998,1997,1996,1995,1994,1993,1992,1991,1990,1989,1988,1987,1986,1985,1984,1983,1982,1981,1980,1979,1978,1977,1976,1975,1974,1973,1972,1971,1970,1969,1968,1967,1966,1965,1964,1963,1962,1961
Queste statistiche in altri paesi:
AlbaniaAlgeriaAngolaArab WorldArgentinaArmeniaAustraliaAustriaAzerbaijanBahrainBangladeshBelarusBelgiumBeninBoliviaBosnia and HerzegovinaBotswanaBrazilBrunei DarussalamBulgariaCambodiaCameroonCanadaCentral Europe and the BalticsChileChinaColombiaCongo, Dem. Rep.Congo, Rep.Costa RicaCote d'IvoireCroatiaCubaCuracaoCyprusCzech RepublicDenmarkDominican RepublicEarly-demographic dividendEast Asia & PacificEast Asia & Pacific (excluding high income)East Asia & Pacific (IDA & IBRD countries)EcuadorEgypt, Arab Rep.El SalvadorEritreaEstoniaEthiopiaEuro areaEurope & Central AsiaEurope & Central Asia (excluding high income)Europe & Central Asia (IDA & IBRD countries)European UnionFinlandFragile and conflict affected situationsFranceGabonGeorgiaGermanyGhanaGibraltarGreeceGuatemalaHaitiHeavily indebted poor countries (HIPC)High incomeHondurasHong Kong SAR, ChinaHungaryIBRD onlyIcelandIDA & IBRD totalIDA blendIDA onlyIDA totalIndiaIndonesiaIran, Islamic Rep.IraqIrelandIsraelItalyJamaicaJapanJordanKazakhstanKenyaKorea, Dem. People’s Rep.Korea, Rep.KosovoKuwaitKyrgyz RepublicLate-demographic dividendLatin America & Caribbean Latin America & Caribbean (excluding high income)Latin America & the Caribbean (IDA & IBRD countries)LatviaLeast developed countries: UN classificationLebanonLibyaLithuaniaLow & middle incomeLower middle incomeLuxembourgMacedonia, FYRMalaysiaMaltaMauritiusMexicoMiddle East & North AfricaMiddle East & North Africa (excluding high income)Middle East & North Africa (IDA & IBRD countries)Middle incomeMoldovaMongoliaMontenegroMoroccoMozambiqueMyanmarNamibiaNepalNetherlandsNew ZealandNicaraguaNigerNigeriaNorth AmericaNorwayOECD membersOmanOther small statesPakistanPanamaParaguayPeruPhilippinesPolandPortugalPost-demographic dividendPre-demographic dividendQatarRomaniaRussian FederationSaudi ArabiaSenegalSerbiaSingaporeSlovak RepublicSloveniaSmall statesSouth AfricaSouth AsiaSouth Asia (IDA & IBRD)South SudanSpainSri LankaSub-Saharan Africa Sub-Saharan Africa (excluding high income)Sub-Saharan Africa (IDA & IBRD countries)SudanSwedenSwitzerlandSyrian Arab RepublicTajikistanTanzaniaThailandTogoTrinidad and TobagoTunisiaTurkeyTurkmenistanUkraineUnited Arab EmiratesUnited KingdomUnited StatesUpper middle incomeUruguayUzbekistanVenezuela, RBVietnamWorldYemen, Rep.ZambiaZimbabwe Linea del tempo:
Questa scala temporale mostra un grafico dal 1961 anno al 2015 anno. Switzerland. I dati fino ad 1960 anno non disponibili. Il numero di osservazioni attuali secondo i date: 55.
La fonte (nome):
Indicatori dello sviluppo mondiale
La fonte (organizzazione):
IEA Statistics © OECD/IEA 2014 (http://www.iea.org/stats/index.asp), subject to https://www.iea.org/t&c/termsandconditions/
Categorie:
Energy & Mining, Climate Change, Infrastructure
sono stati aggiornati
23 apr 2017 anni
Indicatori delle variazioni dei valori per anni
Minima:
0.066
1 gen 2015 anni
Massimo:
11.199
1 gen 1973 anni
Alla data di osservazione
Valore
Variazione assoluta
La variazione rispetto al valore precedente
1 gen 1961 anni
0.87
+0.87
0.0%
1 gen 1962 anni
0.854
-0.016
-1.84%
1 gen 1963 anni
1.153
+0.3
35.11%
1 gen 1964 anni
1.193
+0.04
3.46%
1 gen 1965 anni
1.453
+0.259
21.73%
1 gen 1966 anni
2.081
+0.629
43.27%
1 gen 1967 anni
2.461
+0.38
18.27%
1 gen 1968 anni
3.122
+0.661
26.84%
1 gen 1969 anni
4.525
+1.403
44.94%
1 gen 1970 anni
5.759
+1.234
27.28%
1 gen 1971 anni
6.039
+0.28
4.86%
1 gen 1972 anni
9.349
+3.31
54.81%
1 gen 1973 anni
11.199
+1.85
19.79%
1 gen 1974 anni
7.073
-4.126
-36.84%
1 gen 1975 anni
6.105
-0.968
-13.69%
1 gen 1976 anni
4.055
-2.049
-33.57%
1 gen 1977 anni
6.102
+2.046
50.46%
1 gen 1978 anni
4.358
-1.744
-28.57%
1 gen 1979 anni
3.851
-0.507
-11.64%
1 gen 1980 anni
3.005
-0.846
-21.98%
1 gen 1981 anni
1.021
-1.983
-66.01%
1 gen 1982 anni
0.563
-0.458
-44.84%
1 gen 1983 anni
0.632
+0.069
12.24%
1 gen 1984 anni
0.672
+0.04
6.36%
1 gen 1985 anni
0.523
-0.15
-22.28%
1 gen 1986 anni
0.45
-0.073
-13.87%
1 gen 1987 anni
0.525
+0.075
16.69%
1 gen 1988 anni
0.52
-0.005
-0.92%
1 gen 1989 anni
0.483
-0.038
-7.27%
1 gen 1990 anni
0.554
+0.072
14.89%
1 gen 1991 anni
0.702
+0.147
26.6%
1 gen 1992 anni
1.062
+0.36
51.27%
1 gen 1993 anni
1.266
+0.204
19.19%
1 gen 1994 anni
0.429
-0.837
-66.11%
1 gen 1995 anni
0.468
+0.039
9.07%
1 gen 1996 anni
0.586
+0.119
25.36%
1 gen 1997 anni
0.549
-0.037
-6.32%
1 gen 1998 anni
0.477
-0.072
-13.08%
1 gen 1999 anni
1.085
+0.608
127.24%
1 gen 2000 anni
0.478
-0.607
-55.98%
1 gen 2001 anni
0.343
-0.134
-28.13%
1 gen 2002 anni
0.346
+0.003
0.85%
1 gen 2003 anni
0.345
-0.001
-0.28%
1 gen 2004 anni
0.375
+0.029
8.51%
1 gen 2005 anni
0.316
-0.058
-15.57%
1 gen 2006 anni
0.37
+0.054
17.08%
1 gen 2007 anni
0.322
-0.048
-13.08%
1 gen 2008 anni
0.263
-0.058
-18.17%
1 gen 2009 anni
0.186
-0.077
-29.21%
1 gen 2010 anni
0.154
-0.032
-17.15%
1 gen 2011 anni
0.104
-0.05
-32.38%
1 gen 2012 anni
0.084
-0.02
-19.32%
1 gen 2013 anni
0.078
-0.007
-7.78%
1 gen 2014 anni
0.071
-0.007
-8.38%
1 gen 2015 anni
0.066
-0.005
-7.49%
Classificazione dei paesi secondo i statistiche attuali per anni


Commenti: