29
/it/
it
AIzaSyAYiBZKx7MnpbEhh9jyipgxe19OcubqV5w
April 1, 2024
280852
Venezuela, RB
VEN
true
2
1
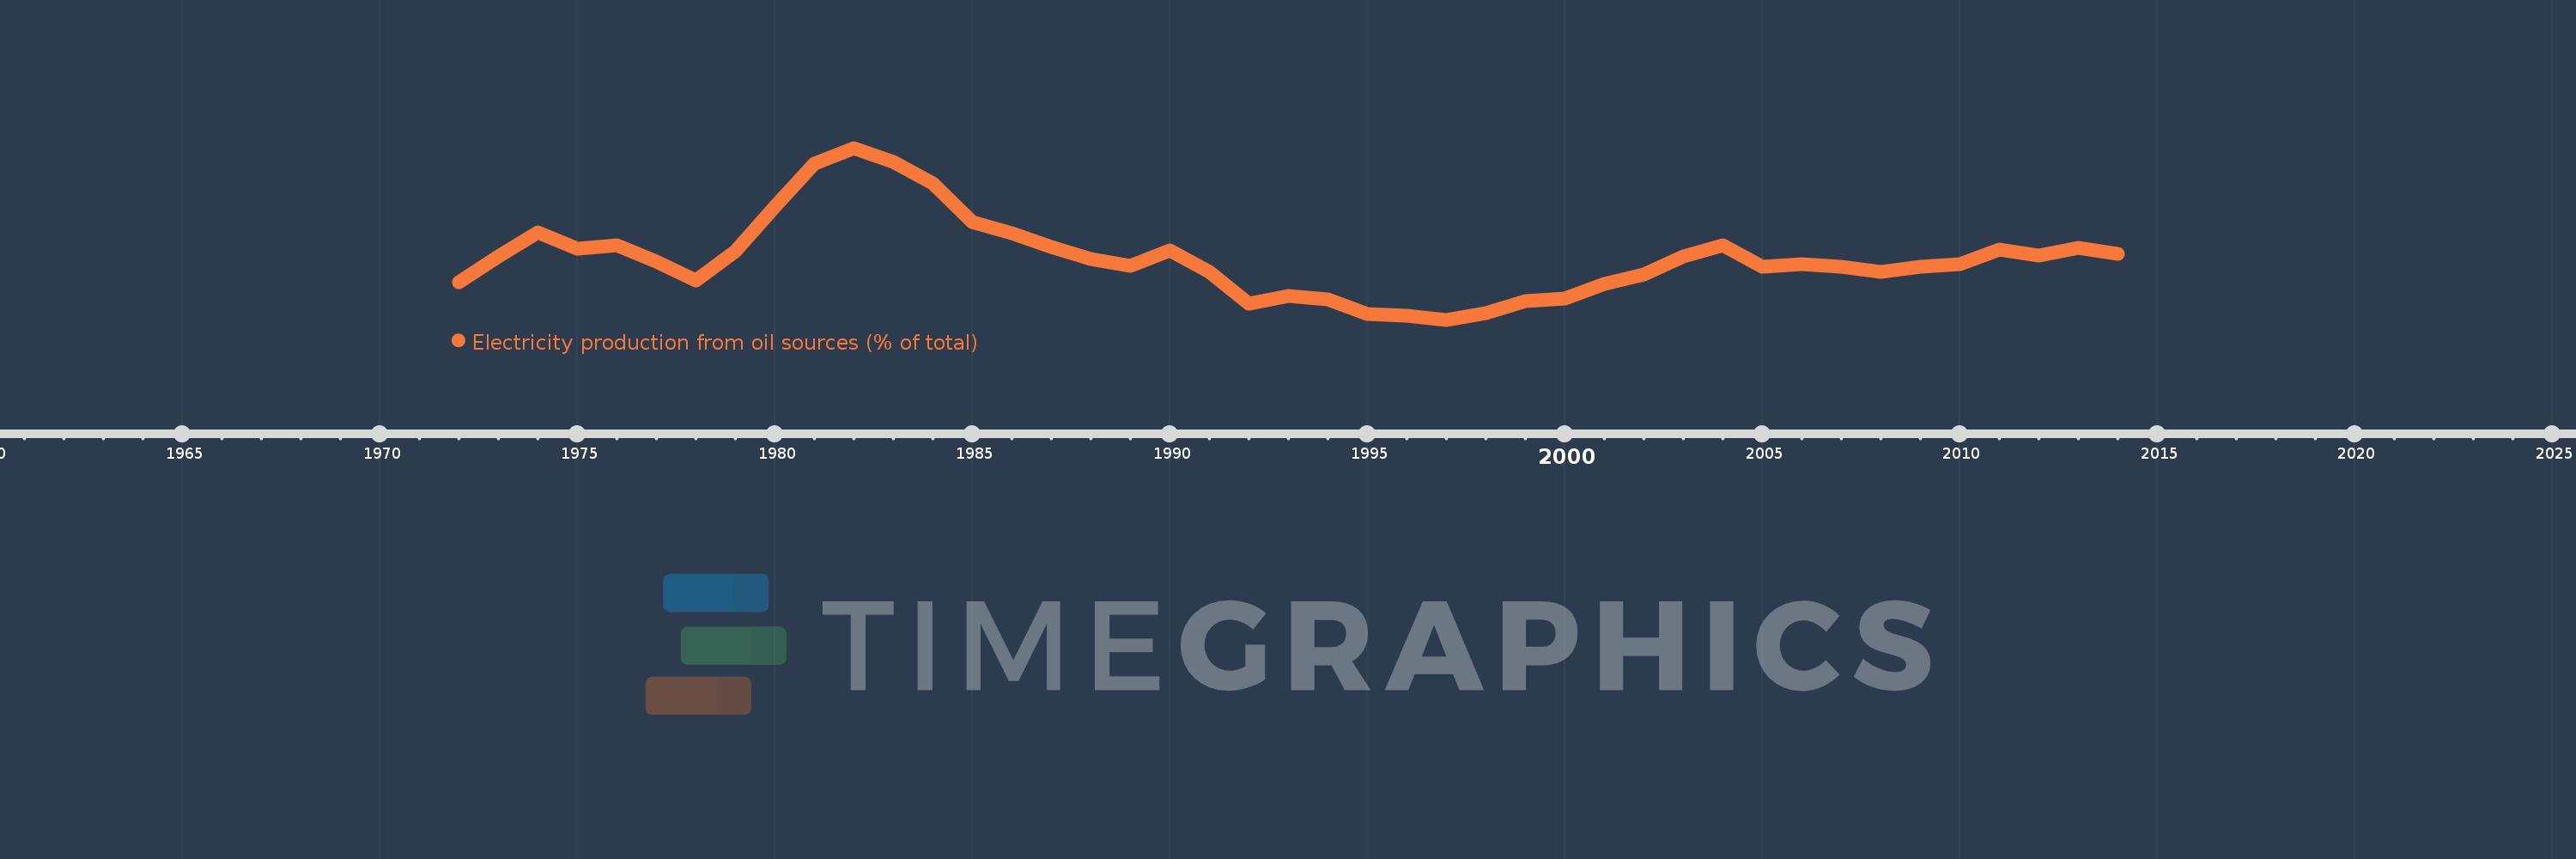
Electricity production from oil sources (% of total)
2014,2013,2012,2011,2010,2009,2008,2007,2006,2005,2004,2003,2002,2001,2000,1999,1998,1997,1996,1995,1994,1993,1992,1991,1990,1989,1988,1987,1986,1985,1984,1983,1982,1981,1980,1979,1978,1977,1976,1975,1974,1973,1972
Queste statistiche in altri paesi:
AlbaniaAlgeriaAngolaArab WorldArgentinaArmeniaAustraliaAustriaAzerbaijanBahrainBangladeshBelarusBelgiumBeninBoliviaBosnia and HerzegovinaBotswanaBrazilBrunei DarussalamBulgariaCambodiaCameroonCanadaCentral Europe and the BalticsChileChinaColombiaCongo, Dem. Rep.Congo, Rep.Costa RicaCote d'IvoireCroatiaCubaCuracaoCyprusCzech RepublicDenmarkDominican RepublicEarly-demographic dividendEast Asia & PacificEast Asia & Pacific (excluding high income)East Asia & Pacific (IDA & IBRD countries)EcuadorEgypt, Arab Rep.El SalvadorEritreaEstoniaEthiopiaEuro areaEurope & Central AsiaEurope & Central Asia (excluding high income)Europe & Central Asia (IDA & IBRD countries)European UnionFinlandFragile and conflict affected situationsFranceGabonGeorgiaGermanyGhanaGibraltarGreeceGuatemalaHaitiHeavily indebted poor countries (HIPC)High incomeHondurasHong Kong SAR, ChinaHungaryIBRD onlyIcelandIDA & IBRD totalIDA blendIDA onlyIDA totalIndiaIndonesiaIran, Islamic Rep.IraqIrelandIsraelItalyJamaicaJapanJordanKazakhstanKenyaKorea, Dem. People’s Rep.Korea, Rep.KosovoKuwaitKyrgyz RepublicLate-demographic dividendLatin America & Caribbean Latin America & Caribbean (excluding high income)Latin America & the Caribbean (IDA & IBRD countries)LatviaLeast developed countries: UN classificationLebanonLibyaLithuaniaLow & middle incomeLower middle incomeLuxembourgMacedonia, FYRMalaysiaMaltaMauritiusMexicoMiddle East & North AfricaMiddle East & North Africa (excluding high income)Middle East & North Africa (IDA & IBRD countries)Middle incomeMoldovaMongoliaMontenegroMoroccoMozambiqueMyanmarNamibiaNepalNetherlandsNew ZealandNicaraguaNigerNigeriaNorth AmericaNorwayOECD membersOmanOther small statesPakistanPanamaParaguayPeruPhilippinesPolandPortugalPost-demographic dividendPre-demographic dividendQatarRomaniaRussian FederationSaudi ArabiaSenegalSerbiaSingaporeSlovak RepublicSloveniaSmall statesSouth AfricaSouth AsiaSouth Asia (IDA & IBRD)South SudanSpainSri LankaSub-Saharan Africa Sub-Saharan Africa (excluding high income)Sub-Saharan Africa (IDA & IBRD countries)SudanSwedenSwitzerlandSyrian Arab RepublicTajikistanTanzaniaThailandTogoTrinidad and TobagoTunisiaTurkeyTurkmenistanUkraineUnited Arab EmiratesUnited KingdomUnited StatesUpper middle incomeUruguayUzbekistanVenezuela, RBVietnamWorldYemen, Rep.ZambiaZimbabwe Linea del tempo:
Questa scala temporale mostra un grafico dal 1972 anno al 2014 anno. Venezuela, RB. I dati fino ad 1971 anno non disponibili. Il numero di osservazioni attuali secondo i date: 43.
La fonte (nome):
Indicatori dello sviluppo mondiale
La fonte (organizzazione):
IEA Statistics © OECD/IEA 2014 (http://www.iea.org/stats/index.asp), subject to https://www.iea.org/t&c/termsandconditions/
Categorie:
Energy & Mining, Climate Change, Infrastructure
sono stati aggiornati
23 apr 2017 anni
Indicatori delle variazioni dei valori per anni
Minima:
2.348
1 gen 1997 anni
Massimo:
35.373
1 gen 1982 anni
Alla data di osservazione
Valore
Variazione assoluta
La variazione rispetto al valore precedente
1 gen 1972 anni
9.618
+9.618
0.0%
1 gen 1973 anni
14.585
+4.967
51.64%
1 gen 1974 anni
19.064
+4.478
30.71%
1 gen 1975 anni
16.05
-3.013
-15.81%
1 gen 1976 anni
16.736
+0.686
4.27%
1 gen 1977 anni
13.607
-3.129
-18.7%
1 gen 1978 anni
9.902
-3.706
-27.23%
1 gen 1979 anni
15.472
+5.571
56.26%
1 gen 1980 anni
24.057
+8.585
55.48%
1 gen 1981 anni
32.36
+8.303
34.52%
1 gen 1982 anni
35.373
+3.012
9.31%
1 gen 1983 anni
32.656
-2.717
-7.68%
1 gen 1984 anni
28.628
-4.028
-12.34%
1 gen 1985 anni
21.192
-7.436
-25.97%
1 gen 1986 anni
19.032
-2.16
-10.19%
1 gen 1987 anni
16.288
-2.744
-14.42%
1 gen 1988 anni
14.016
-2.272
-13.95%
1 gen 1989 anni
12.69
-1.326
-9.46%
1 gen 1990 anni
15.606
+2.916
22.98%
1 gen 1991 anni
11.504
-4.102
-26.29%
1 gen 1992 anni
5.442
-6.061
-52.69%
1 gen 1993 anni
6.849
+1.407
25.85%
1 gen 1994 anni
6.189
-0.66
-9.64%
1 gen 1995 anni
3.467
-2.722
-43.99%
1 gen 1996 anni
3.185
-0.282
-8.14%
1 gen 1997 anni
2.348
-0.836
-26.26%
1 gen 1998 anni
3.596
+1.247
53.12%
1 gen 1999 anni
5.894
+2.298
63.9%
1 gen 2000 anni
6.46
+0.566
9.61%
1 gen 2001 anni
9.266
+2.806
43.44%
1 gen 2002 anni
11.09
+1.824
19.69%
1 gen 2003 anni
14.533
+3.443
31.05%
1 gen 2004 anni
16.583
+2.05
14.1%
1 gen 2005 anni
12.538
-4.045
-24.39%
1 gen 2006 anni
13.113
+0.575
4.59%
1 gen 2007 anni
12.613
-0.5
-3.81%
1 gen 2008 anni
11.506
-1.108
-8.78%
1 gen 2009 anni
12.541
+1.035
9.0%
1 gen 2010 anni
12.974
+0.433
3.45%
1 gen 2011 anni
15.841
+2.867
22.1%
1 gen 2012 anni
14.763
-1.078
-6.81%
1 gen 2013 anni
16.127
+1.365
9.24%
1 gen 2014 anni
15.037
-1.09
-6.76%
Classificazione dei paesi secondo i statistiche attuali per anni


Commenti: