29
/it/
it
AIzaSyAYiBZKx7MnpbEhh9jyipgxe19OcubqV5w
April 1, 2024
66495
Algeria
DZA
true
2
1
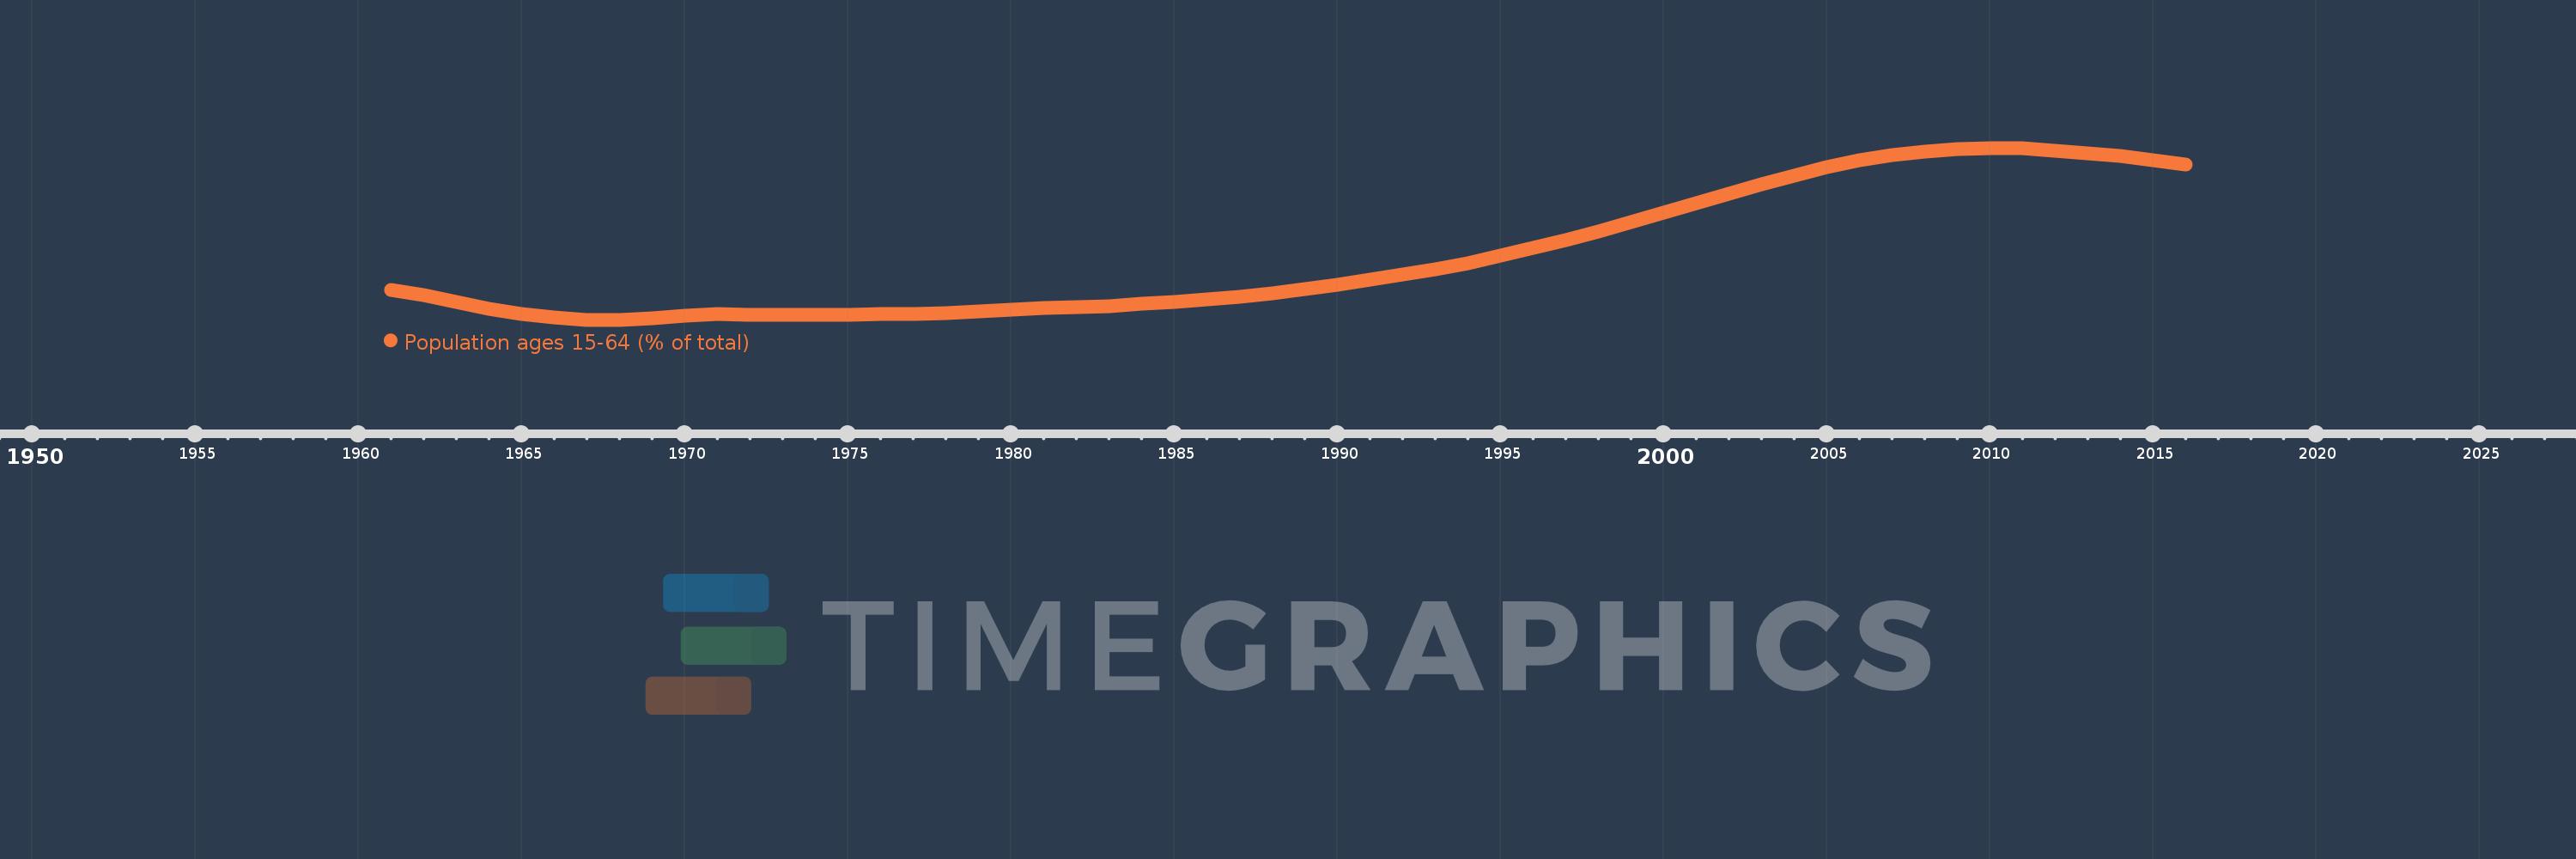
Population ages 15-64 (% of total)
2016,2015,2014,2013,2012,2011,2010,2009,2008,2007,2006,2005,2004,2003,2002,2001,2000,1999,1998,1997,1996,1995,1994,1993,1992,1991,1990,1989,1988,1987,1986,1985,1984,1983,1982,1981,1980,1979,1978,1977,1976,1975,1974,1973,1972,1971,1970,1969,1968,1967,1966,1965,1964,1963,1962,1961
Queste statistiche in altri paesi:
AfghanistanAlbaniaAlgeriaAngolaAntigua and BarbudaArab WorldArgentinaArmeniaArubaAustraliaAustriaAzerbaijanBahamas, TheBahrainBangladeshBarbadosBelarusBelgiumBelizeBeninBhutanBoliviaBosnia and HerzegovinaBotswanaBrazilBrunei DarussalamBulgariaBurkina FasoBurundiCabo VerdeCambodiaCameroonCanadaCaribbean small statesCentral African RepublicCentral Europe and the BalticsChadChannel IslandsChileChinaColombiaComorosCongo, Dem. Rep.Congo, Rep.Costa RicaCote d'IvoireCroatiaCubaCuracaoCyprusCzech RepublicDenmarkDjiboutiDominican RepublicEarly-demographic dividendEast Asia & PacificEast Asia & Pacific (excluding high income)East Asia & Pacific (IDA & IBRD countries)EcuadorEgypt, Arab Rep.El SalvadorEquatorial GuineaEritreaEstoniaEthiopiaEuro areaEurope & Central AsiaEurope & Central Asia (excluding high income)Europe & Central Asia (IDA & IBRD countries)European UnionFijiFinlandFragile and conflict affected situationsFranceFrench PolynesiaGabonGambia, TheGeorgiaGermanyGhanaGreeceGrenadaGuamGuatemalaGuineaGuinea-BissauGuyanaHaitiHeavily indebted poor countries (HIPC)High incomeHondurasHong Kong SAR, ChinaHungaryIBRD onlyIcelandIDA & IBRD totalIDA blendIDA onlyIDA totalIndiaIndonesiaIran, Islamic Rep.IraqIrelandIsraelItalyJamaicaJapanJordanKazakhstanKenyaKiribatiKorea, Dem. People’s Rep.Korea, Rep.KosovoKuwaitKyrgyz RepublicLao PDRLate-demographic dividendLatin America & Caribbean Latin America & Caribbean (excluding high income)Latin America & the Caribbean (IDA & IBRD countries)LatviaLeast developed countries: UN classificationLebanonLesothoLiberiaLibyaLithuaniaLow & middle incomeLow incomeLower middle incomeLuxembourgMacao SAR, ChinaMacedonia, FYRMadagascarMalawiMalaysiaMaldivesMaliMaltaMauritaniaMauritiusMexicoMicronesia, Fed. Sts.Middle East & North AfricaMiddle East & North Africa (excluding high income)Middle East & North Africa (IDA & IBRD countries)Middle incomeMoldovaMongoliaMontenegroMoroccoMozambiqueMyanmarNamibiaNepalNetherlandsNew CaledoniaNew ZealandNicaraguaNigerNigeriaNorth AmericaNorwayOECD membersOmanOther small statesPacific island small statesPakistanPanamaPapua New GuineaParaguayPeruPhilippinesPolandPortugalPost-demographic dividendPre-demographic dividendPuerto RicoQatarRomaniaRussian FederationRwandaSamoaSao Tome and PrincipeSaudi ArabiaSenegalSerbiaSeychellesSierra LeoneSingaporeSlovak RepublicSloveniaSmall statesSolomon IslandsSomaliaSouth AfricaSouth AsiaSouth Asia (IDA & IBRD)South SudanSpainSri LankaSt. LuciaSt. Vincent and the GrenadinesSub-Saharan Africa Sub-Saharan Africa (excluding high income)Sub-Saharan Africa (IDA & IBRD countries)SudanSurinameSwazilandSwedenSwitzerlandSyrian Arab RepublicTajikistanTanzaniaThailandTimor-LesteTogoTongaTrinidad and TobagoTunisiaTurkeyTurkmenistanUgandaUkraineUnited Arab EmiratesUnited KingdomUnited StatesUpper middle incomeUruguayUzbekistanVanuatuVenezuela, RBVietnamVirgin Islands (U.S.)West Bank and GazaWorldYemen, Rep.ZambiaZimbabwe Linea del tempo:
Questa scala temporale mostra un grafico dal 1961 anno al 2016 anno. Algeria. I dati fino ad 1960 anno non disponibili. Il numero di osservazioni attuali secondo i date: 56.
La fonte (nome):
Indicatori dello sviluppo mondiale
La fonte (organizzazione):
World Bank staff estimates based on age distributions of United Nations Population Division's World Population Prospects.
Categorie:
Education, Health
sono stati aggiornati
23 apr 2017 anni
Indicatori delle variazioni dei valori per anni
Minima:
49.052
1 gen 1967 anni
Massimo:
67.274
1 gen 2010 anni
Alla data di osservazione
Valore
Variazione assoluta
La variazione rispetto al valore precedente
1 gen 1961 anni
52.24
+52.24
0.0%
1 gen 1962 anni
51.655
-0.585
-1.12%
1 gen 1963 anni
50.923
-0.732
-1.42%
1 gen 1964 anni
50.184
-0.739
-1.45%
1 gen 1965 anni
49.626
-0.558
-1.11%
1 gen 1966 anni
49.326
-0.3
-0.6%
1 gen 1967 anni
49.052
-0.274
-0.56%
1 gen 1968 anni
49.061
+0.009
0.02%
1 gen 1969 anni
49.247
+0.186
0.38%
1 gen 1970 anni
49.459
+0.212
0.43%
1 gen 1971 anni
49.625
+0.166
0.34%
1 gen 1972 anni
49.612
-0.013
-0.03%
1 gen 1973 anni
49.576
-0.036
-0.07%
1 gen 1974 anni
49.545
-0.031
-0.06%
1 gen 1975 anni
49.571
+0.026
0.05%
1 gen 1976 anni
49.674
+0.103
0.21%
1 gen 1977 anni
49.682
+0.008
0.02%
1 gen 1978 anni
49.781
+0.099
0.2%
1 gen 1979 anni
49.938
+0.157
0.32%
1 gen 1980 anni
50.112
+0.175
0.35%
1 gen 1981 anni
50.284
+0.172
0.34%
1 gen 1982 anni
50.381
+0.097
0.19%
1 gen 1983 anni
50.525
+0.144
0.28%
1 gen 1984 anni
50.712
+0.187
0.37%
1 gen 1985 anni
50.95
+0.239
0.47%
1 gen 1986 anni
51.247
+0.297
0.58%
1 gen 1987 anni
51.528
+0.28
0.55%
1 gen 1988 anni
51.876
+0.349
0.68%
1 gen 1989 anni
52.286
+0.41
0.79%
1 gen 1990 anni
52.756
+0.469
0.9%
1 gen 1991 anni
53.283
+0.528
1.0%
1 gen 1992 anni
53.819
+0.536
1.01%
1 gen 1993 anni
54.415
+0.596
1.11%
1 gen 1994 anni
55.079
+0.663
1.22%
1 gen 1995 anni
55.822
+0.743
1.35%
1 gen 1996 anni
56.652
+0.83
1.49%
1 gen 1997 anni
57.484
+0.832
1.47%
1 gen 1998 anni
58.408
+0.924
1.61%
1 gen 1999 anni
59.397
+0.989
1.69%
1 gen 2000 anni
60.403
+1.006
1.69%
1 gen 2001 anni
61.393
+0.989
1.64%
1 gen 2002 anni
62.459
+1.066
1.74%
1 gen 2003 anni
63.446
+0.987
1.58%
1 gen 2004 anni
64.359
+0.913
1.44%
1 gen 2005 anni
65.197
+0.838
1.3%
1 gen 2006 anni
65.934
+0.737
1.13%
1 gen 2007 anni
66.489
+0.555
0.84%
1 gen 2008 anni
66.895
+0.406
0.61%
1 gen 2009 anni
67.155
+0.26
0.39%
1 gen 2010 anni
67.274
+0.12
0.18%
1 gen 2011 anni
67.258
-0.017
-0.02%
1 gen 2012 anni
67.009
-0.249
-0.37%
1 gen 2013 anni
66.734
-0.275
-0.41%
1 gen 2014 anni
66.401
-0.334
-0.5%
1 gen 2015 anni
65.991
-0.41
-0.62%
1 gen 2016 anni
65.523
-0.467
-0.71%
Classificazione dei paesi secondo i statistiche attuali per anni


Commenti: