29
/it/
it
AIzaSyAYiBZKx7MnpbEhh9jyipgxe19OcubqV5w
April 1, 2024
202073
Morocco
MAR
true
2
1
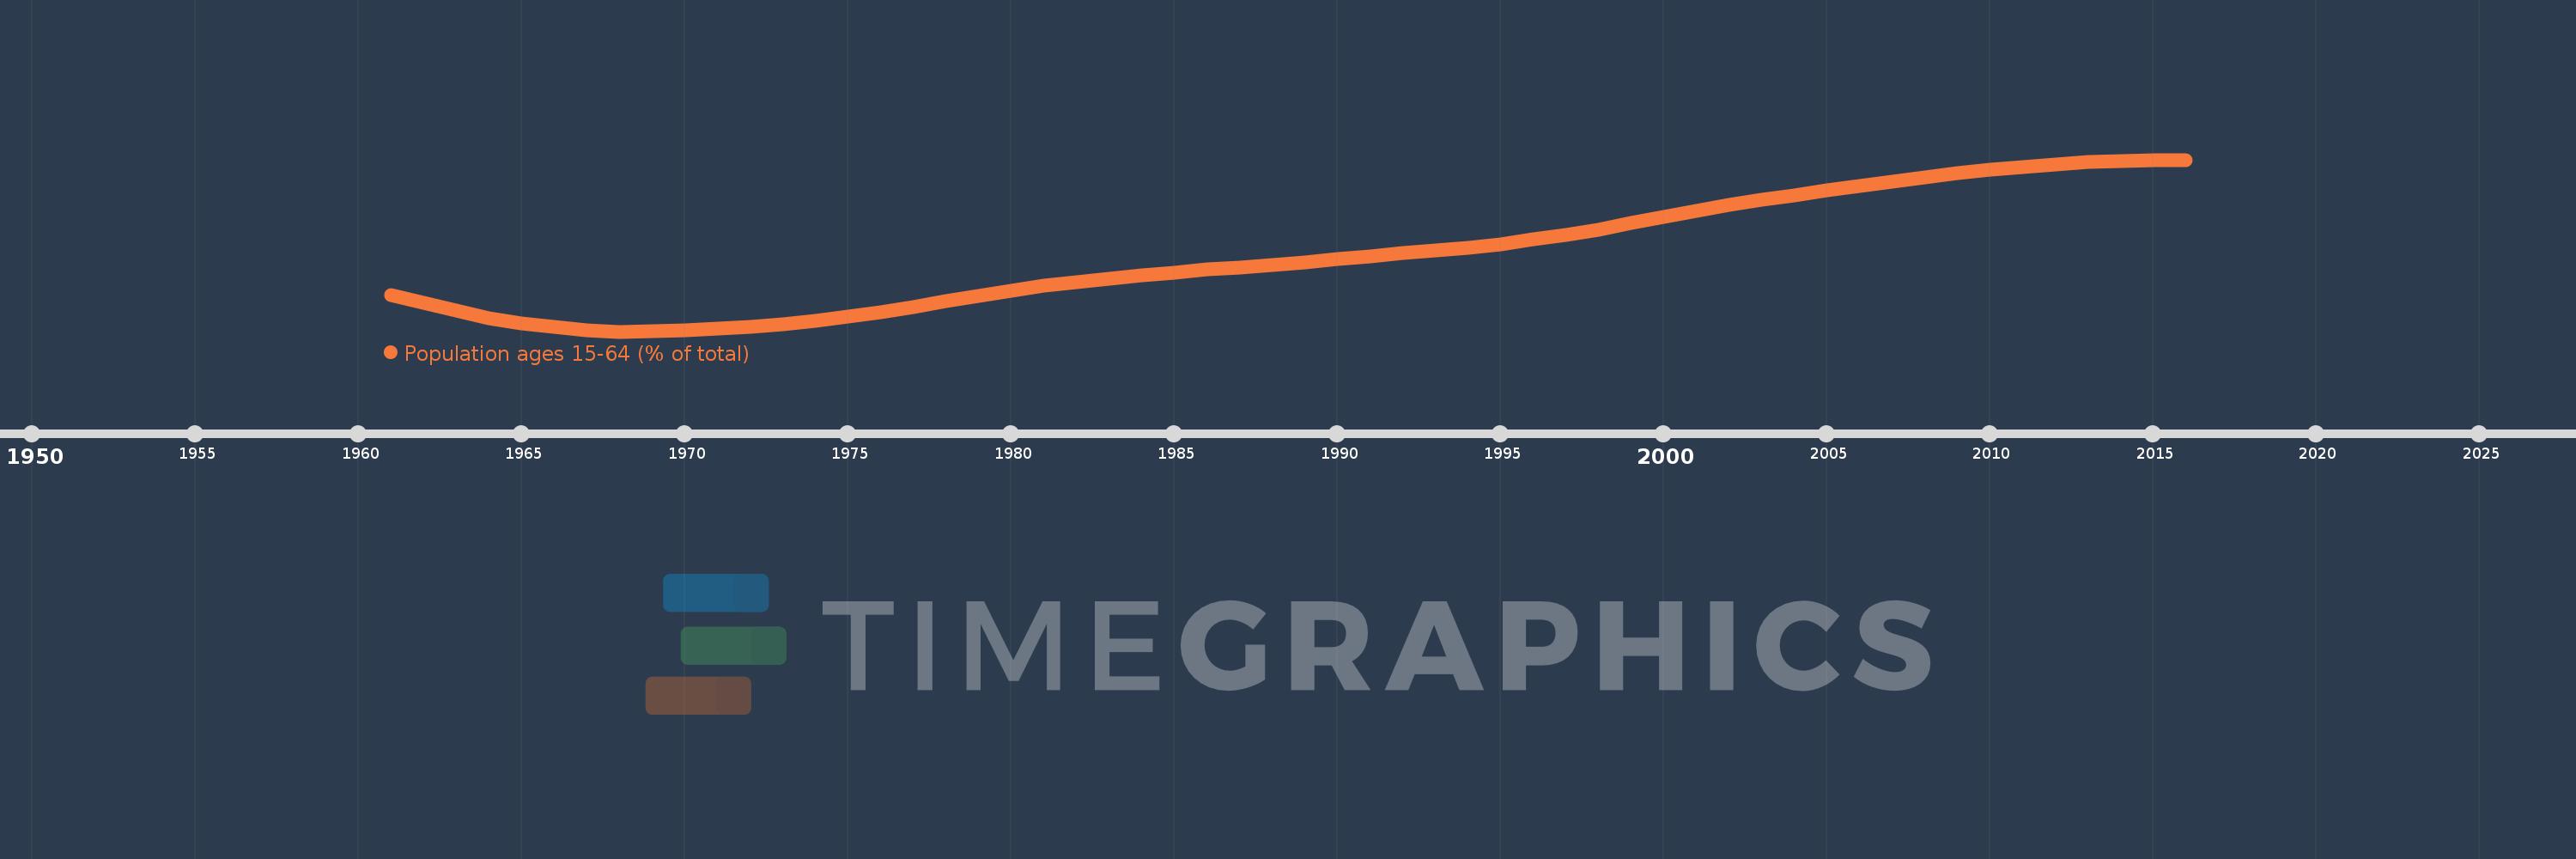
Population ages 15-64 (% of total)
2016,2015,2014,2013,2012,2011,2010,2009,2008,2007,2006,2005,2004,2003,2002,2001,2000,1999,1998,1997,1996,1995,1994,1993,1992,1991,1990,1989,1988,1987,1986,1985,1984,1983,1982,1981,1980,1979,1978,1977,1976,1975,1974,1973,1972,1971,1970,1969,1968,1967,1966,1965,1964,1963,1962,1961
Queste statistiche in altri paesi:
AfghanistanAlbaniaAlgeriaAngolaAntigua and BarbudaArab WorldArgentinaArmeniaArubaAustraliaAustriaAzerbaijanBahamas, TheBahrainBangladeshBarbadosBelarusBelgiumBelizeBeninBhutanBoliviaBosnia and HerzegovinaBotswanaBrazilBrunei DarussalamBulgariaBurkina FasoBurundiCabo VerdeCambodiaCameroonCanadaCaribbean small statesCentral African RepublicCentral Europe and the BalticsChadChannel IslandsChileChinaColombiaComorosCongo, Dem. Rep.Congo, Rep.Costa RicaCote d'IvoireCroatiaCubaCuracaoCyprusCzech RepublicDenmarkDjiboutiDominican RepublicEarly-demographic dividendEast Asia & PacificEast Asia & Pacific (excluding high income)East Asia & Pacific (IDA & IBRD countries)EcuadorEgypt, Arab Rep.El SalvadorEquatorial GuineaEritreaEstoniaEthiopiaEuro areaEurope & Central AsiaEurope & Central Asia (excluding high income)Europe & Central Asia (IDA & IBRD countries)European UnionFijiFinlandFragile and conflict affected situationsFranceFrench PolynesiaGabonGambia, TheGeorgiaGermanyGhanaGreeceGrenadaGuamGuatemalaGuineaGuinea-BissauGuyanaHaitiHeavily indebted poor countries (HIPC)High incomeHondurasHong Kong SAR, ChinaHungaryIBRD onlyIcelandIDA & IBRD totalIDA blendIDA onlyIDA totalIndiaIndonesiaIran, Islamic Rep.IraqIrelandIsraelItalyJamaicaJapanJordanKazakhstanKenyaKiribatiKorea, Dem. People’s Rep.Korea, Rep.KosovoKuwaitKyrgyz RepublicLao PDRLate-demographic dividendLatin America & Caribbean Latin America & Caribbean (excluding high income)Latin America & the Caribbean (IDA & IBRD countries)LatviaLeast developed countries: UN classificationLebanonLesothoLiberiaLibyaLithuaniaLow & middle incomeLow incomeLower middle incomeLuxembourgMacao SAR, ChinaMacedonia, FYRMadagascarMalawiMalaysiaMaldivesMaliMaltaMauritaniaMauritiusMexicoMicronesia, Fed. Sts.Middle East & North AfricaMiddle East & North Africa (excluding high income)Middle East & North Africa (IDA & IBRD countries)Middle incomeMoldovaMongoliaMontenegroMoroccoMozambiqueMyanmarNamibiaNepalNetherlandsNew CaledoniaNew ZealandNicaraguaNigerNigeriaNorth AmericaNorwayOECD membersOmanOther small statesPacific island small statesPakistanPanamaPapua New GuineaParaguayPeruPhilippinesPolandPortugalPost-demographic dividendPre-demographic dividendPuerto RicoQatarRomaniaRussian FederationRwandaSamoaSao Tome and PrincipeSaudi ArabiaSenegalSerbiaSeychellesSierra LeoneSingaporeSlovak RepublicSloveniaSmall statesSolomon IslandsSomaliaSouth AfricaSouth AsiaSouth Asia (IDA & IBRD)South SudanSpainSri LankaSt. LuciaSt. Vincent and the GrenadinesSub-Saharan Africa Sub-Saharan Africa (excluding high income)Sub-Saharan Africa (IDA & IBRD countries)SudanSurinameSwazilandSwedenSwitzerlandSyrian Arab RepublicTajikistanTanzaniaThailandTimor-LesteTogoTongaTrinidad and TobagoTunisiaTurkeyTurkmenistanUgandaUkraineUnited Arab EmiratesUnited KingdomUnited StatesUpper middle incomeUruguayUzbekistanVanuatuVenezuela, RBVietnamVirgin Islands (U.S.)West Bank and GazaWorldYemen, Rep.ZambiaZimbabwe Linea del tempo:
Questa scala temporale mostra un grafico dal 1961 anno al 2016 anno. Morocco. I dati fino ad 1960 anno non disponibili. Il numero di osservazioni attuali secondo i date: 56.
La fonte (nome):
Indicatori dello sviluppo mondiale
La fonte (organizzazione):
World Bank staff estimates based on age distributions of United Nations Population Division's World Population Prospects.
Categorie:
Education, Health
sono stati aggiornati
23 apr 2017 anni
Indicatori delle variazioni dei valori per anni
Minima:
48.501
1 gen 1968 anni
Massimo:
66.61
1 gen 2016 anni
Alla data di osservazione
Valore
Variazione assoluta
La variazione rispetto al valore precedente
1 gen 1961 anni
52.313
+52.313
0.0%
1 gen 1962 anni
51.552
-0.761
-1.45%
1 gen 1963 anni
50.712
-0.84
-1.63%
1 gen 1964 anni
49.912
-0.8
-1.58%
1 gen 1965 anni
49.317
-0.595
-1.19%
1 gen 1966 anni
48.997
-0.319
-0.65%
1 gen 1967 anni
48.634
-0.363
-0.74%
1 gen 1968 anni
48.501
-0.133
-0.27%
1 gen 1969 anni
48.542
+0.041
0.08%
1 gen 1970 anni
48.667
+0.126
0.26%
1 gen 1971 anni
48.842
+0.175
0.36%
1 gen 1972 anni
49.03
+0.188
0.39%
1 gen 1973 anni
49.302
+0.272
0.55%
1 gen 1974 anni
49.652
+0.35
0.71%
1 gen 1975 anni
50.08
+0.428
0.86%
1 gen 1976 anni
50.576
+0.496
0.99%
1 gen 1977 anni
51.104
+0.528
1.04%
1 gen 1978 anni
51.673
+0.569
1.11%
1 gen 1979 anni
52.261
+0.588
1.14%
1 gen 1980 anni
52.835
+0.574
1.1%
1 gen 1981 anni
53.371
+0.536
1.01%
1 gen 1982 anni
53.737
+0.366
0.69%
1 gen 1983 anni
54.082
+0.345
0.64%
1 gen 1984 anni
54.406
+0.324
0.6%
1 gen 1985 anni
54.721
+0.315
0.58%
1 gen 1986 anni
55.044
+0.323
0.59%
1 gen 1987 anni
55.242
+0.198
0.36%
1 gen 1988 anni
55.513
+0.272
0.49%
1 gen 1989 anni
55.828
+0.314
0.57%
1 gen 1990 anni
56.138
+0.311
0.56%
1 gen 1991 anni
56.428
+0.29
0.52%
1 gen 1992 anni
56.788
+0.36
0.64%
1 gen 1993 anni
57.075
+0.287
0.51%
1 gen 1994 anni
57.354
+0.28
0.49%
1 gen 1995 anni
57.716
+0.362
0.63%
1 gen 1996 anni
58.197
+0.481
0.83%
1 gen 1997 anni
58.651
+0.454
0.78%
1 gen 1998 anni
59.24
+0.589
1.0%
1 gen 1999 anni
59.91
+0.67
1.13%
1 gen 2000 anni
60.574
+0.664
1.11%
1 gen 2001 anni
61.191
+0.617
1.02%
1 gen 2002 anni
61.815
+0.624
1.02%
1 gen 2003 anni
62.367
+0.552
0.89%
1 gen 2004 anni
62.869
+0.502
0.8%
1 gen 2005 anni
63.353
+0.483
0.77%
1 gen 2006 anni
63.823
+0.471
0.74%
1 gen 2007 anni
64.319
+0.496
0.78%
1 gen 2008 anni
64.774
+0.455
0.71%
1 gen 2009 anni
65.19
+0.416
0.64%
1 gen 2010 anni
65.563
+0.373
0.57%
1 gen 2011 anni
65.884
+0.321
0.49%
1 gen 2012 anni
66.123
+0.239
0.36%
1 gen 2013 anni
66.339
+0.216
0.33%
1 gen 2014 anni
66.503
+0.164
0.25%
1 gen 2015 anni
66.593
+0.09
0.14%
1 gen 2016 anni
66.61
+0.016
0.02%
Classificazione dei paesi secondo i statistiche attuali per anni


Commenti: