29
/it/
it
AIzaSyAYiBZKx7MnpbEhh9jyipgxe19OcubqV5w
April 1, 2024
232616
Samoa
WSM
true
2
1
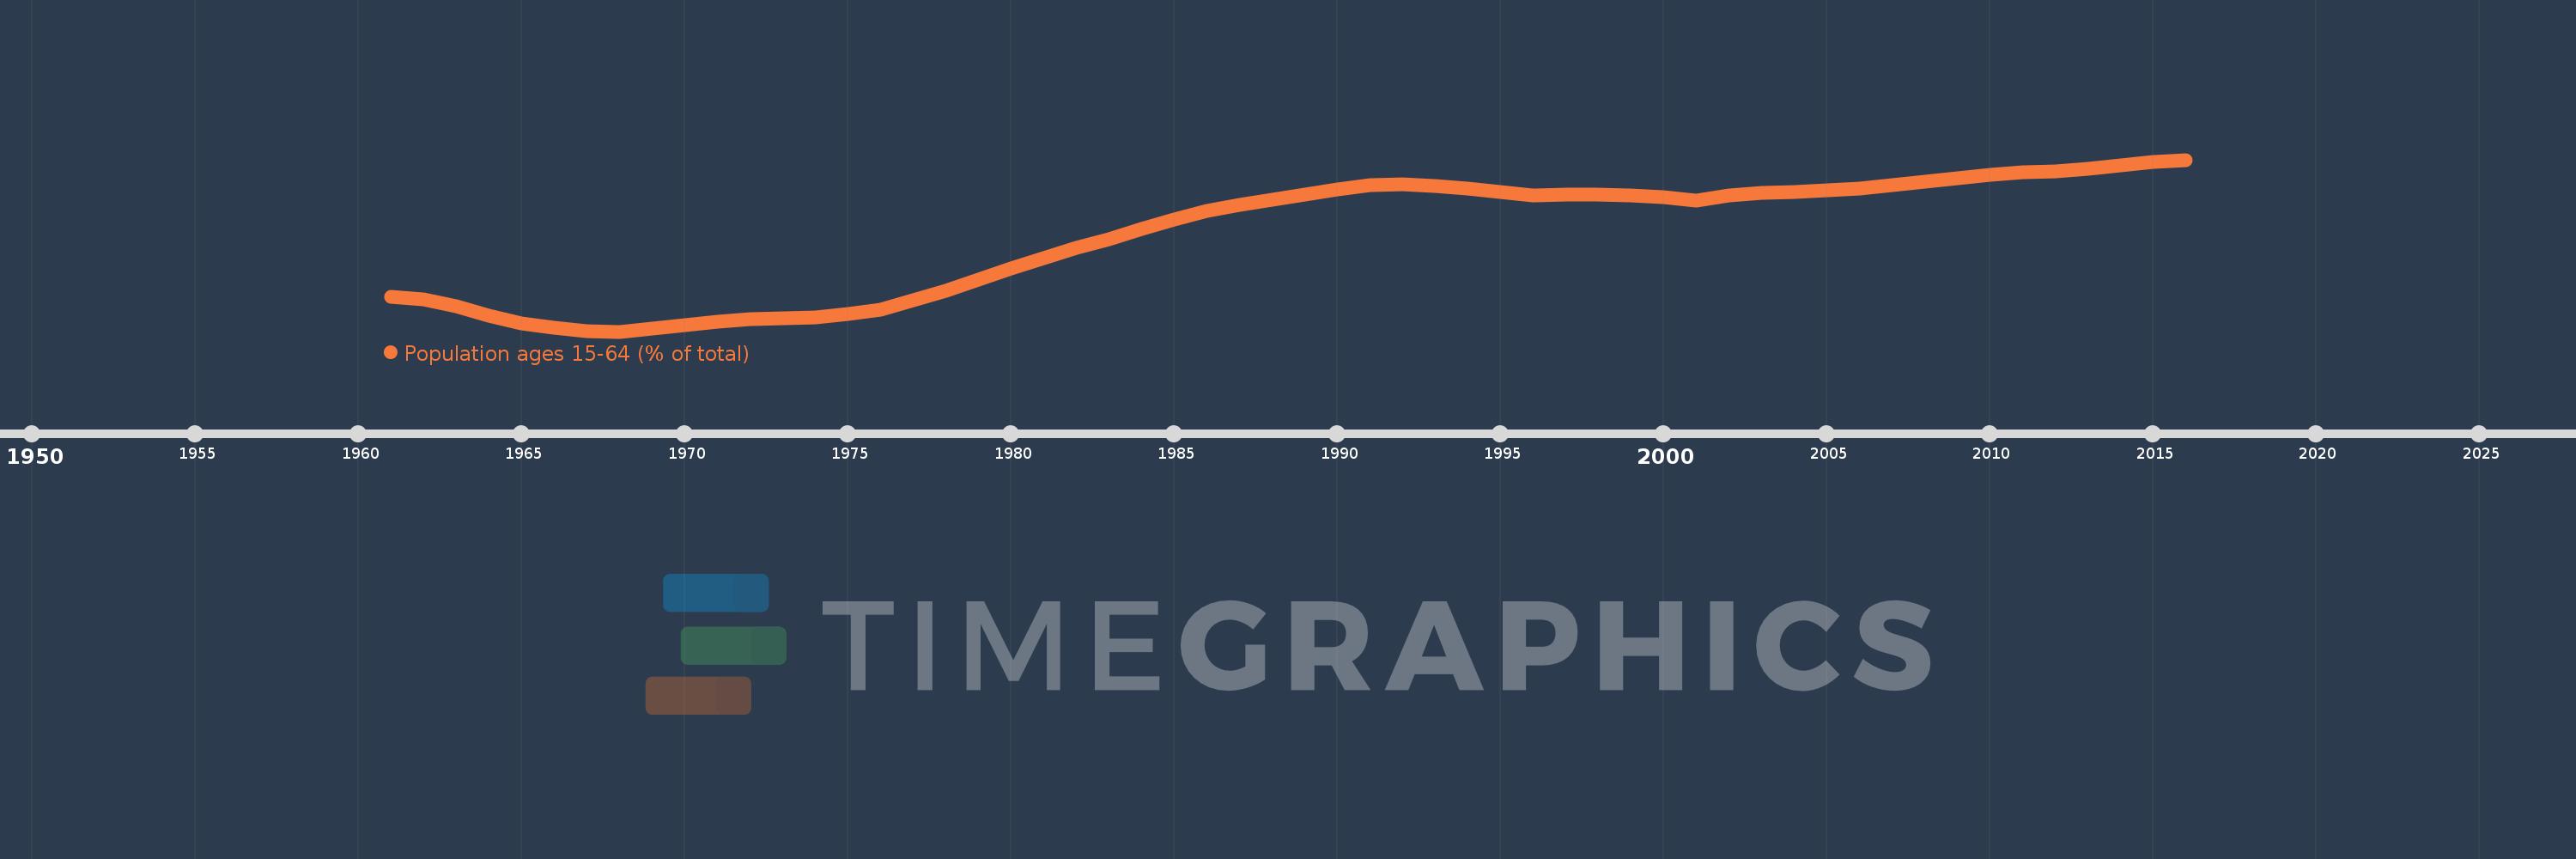
Population ages 15-64 (% of total)
2016,2015,2014,2013,2012,2011,2010,2009,2008,2007,2006,2005,2004,2003,2002,2001,2000,1999,1998,1997,1996,1995,1994,1993,1992,1991,1990,1989,1988,1987,1986,1985,1984,1983,1982,1981,1980,1979,1978,1977,1976,1975,1974,1973,1972,1971,1970,1969,1968,1967,1966,1965,1964,1963,1962,1961
Queste statistiche in altri paesi:
AfghanistanAlbaniaAlgeriaAngolaAntigua and BarbudaArab WorldArgentinaArmeniaArubaAustraliaAustriaAzerbaijanBahamas, TheBahrainBangladeshBarbadosBelarusBelgiumBelizeBeninBhutanBoliviaBosnia and HerzegovinaBotswanaBrazilBrunei DarussalamBulgariaBurkina FasoBurundiCabo VerdeCambodiaCameroonCanadaCaribbean small statesCentral African RepublicCentral Europe and the BalticsChadChannel IslandsChileChinaColombiaComorosCongo, Dem. Rep.Congo, Rep.Costa RicaCote d'IvoireCroatiaCubaCuracaoCyprusCzech RepublicDenmarkDjiboutiDominican RepublicEarly-demographic dividendEast Asia & PacificEast Asia & Pacific (excluding high income)East Asia & Pacific (IDA & IBRD countries)EcuadorEgypt, Arab Rep.El SalvadorEquatorial GuineaEritreaEstoniaEthiopiaEuro areaEurope & Central AsiaEurope & Central Asia (excluding high income)Europe & Central Asia (IDA & IBRD countries)European UnionFijiFinlandFragile and conflict affected situationsFranceFrench PolynesiaGabonGambia, TheGeorgiaGermanyGhanaGreeceGrenadaGuamGuatemalaGuineaGuinea-BissauGuyanaHaitiHeavily indebted poor countries (HIPC)High incomeHondurasHong Kong SAR, ChinaHungaryIBRD onlyIcelandIDA & IBRD totalIDA blendIDA onlyIDA totalIndiaIndonesiaIran, Islamic Rep.IraqIrelandIsraelItalyJamaicaJapanJordanKazakhstanKenyaKiribatiKorea, Dem. People’s Rep.Korea, Rep.KosovoKuwaitKyrgyz RepublicLao PDRLate-demographic dividendLatin America & Caribbean Latin America & Caribbean (excluding high income)Latin America & the Caribbean (IDA & IBRD countries)LatviaLeast developed countries: UN classificationLebanonLesothoLiberiaLibyaLithuaniaLow & middle incomeLow incomeLower middle incomeLuxembourgMacao SAR, ChinaMacedonia, FYRMadagascarMalawiMalaysiaMaldivesMaliMaltaMauritaniaMauritiusMexicoMicronesia, Fed. Sts.Middle East & North AfricaMiddle East & North Africa (excluding high income)Middle East & North Africa (IDA & IBRD countries)Middle incomeMoldovaMongoliaMontenegroMoroccoMozambiqueMyanmarNamibiaNepalNetherlandsNew CaledoniaNew ZealandNicaraguaNigerNigeriaNorth AmericaNorwayOECD membersOmanOther small statesPacific island small statesPakistanPanamaPapua New GuineaParaguayPeruPhilippinesPolandPortugalPost-demographic dividendPre-demographic dividendPuerto RicoQatarRomaniaRussian FederationRwandaSamoaSao Tome and PrincipeSaudi ArabiaSenegalSerbiaSeychellesSierra LeoneSingaporeSlovak RepublicSloveniaSmall statesSolomon IslandsSomaliaSouth AfricaSouth AsiaSouth Asia (IDA & IBRD)South SudanSpainSri LankaSt. LuciaSt. Vincent and the GrenadinesSub-Saharan Africa Sub-Saharan Africa (excluding high income)Sub-Saharan Africa (IDA & IBRD countries)SudanSurinameSwazilandSwedenSwitzerlandSyrian Arab RepublicTajikistanTanzaniaThailandTimor-LesteTogoTongaTrinidad and TobagoTunisiaTurkeyTurkmenistanUgandaUkraineUnited Arab EmiratesUnited KingdomUnited StatesUpper middle incomeUruguayUzbekistanVanuatuVenezuela, RBVietnamVirgin Islands (U.S.)West Bank and GazaWorldYemen, Rep.ZambiaZimbabwe Linea del tempo:
Questa scala temporale mostra un grafico dal 1961 anno al 2016 anno. Samoa. I dati fino ad 1960 anno non disponibili. Il numero di osservazioni attuali secondo i date: 56.
La fonte (nome):
Indicatori dello sviluppo mondiale
La fonte (organizzazione):
World Bank staff estimates based on age distributions of United Nations Population Division's World Population Prospects.
Categorie:
Education, Health
sono stati aggiornati
23 apr 2017 anni
Indicatori delle variazioni dei valori per anni
Minima:
46.113
1 gen 1968 anni
Massimo:
57.476
1 gen 2016 anni
Alla data di osservazione
Valore
Variazione assoluta
La variazione rispetto al valore precedente
1 gen 1961 anni
48.434
+48.434
0.0%
1 gen 1962 anni
48.243
-0.19
-0.39%
1 gen 1963 anni
47.773
-0.47
-0.97%
1 gen 1964 anni
47.169
-0.605
-1.27%
1 gen 1965 anni
46.653
-0.516
-1.09%
1 gen 1966 anni
46.342
-0.311
-0.67%
1 gen 1967 anni
46.125
-0.217
-0.47%
1 gen 1968 anni
46.113
-0.012
-0.03%
1 gen 1969 anni
46.287
+0.174
0.38%
1 gen 1970 anni
46.534
+0.247
0.53%
1 gen 1971 anni
46.777
+0.243
0.52%
1 gen 1972 anni
46.915
+0.138
0.3%
1 gen 1973 anni
46.977
+0.062
0.13%
1 gen 1974 anni
47.063
+0.086
0.18%
1 gen 1975 anni
47.258
+0.196
0.42%
1 gen 1976 anni
47.588
+0.33
0.7%
1 gen 1977 anni
48.183
+0.595
1.25%
1 gen 1978 anni
48.833
+0.65
1.35%
1 gen 1979 anni
49.551
+0.717
1.47%
1 gen 1980 anni
50.291
+0.74
1.49%
1 gen 1981 anni
50.999
+0.708
1.41%
1 gen 1982 anni
51.631
+0.632
1.24%
1 gen 1983 anni
52.245
+0.614
1.19%
1 gen 1984 anni
52.878
+0.633
1.21%
1 gen 1985 anni
53.513
+0.635
1.2%
1 gen 1986 anni
54.113
+0.6
1.12%
1 gen 1987 anni
54.515
+0.402
0.74%
1 gen 1988 anni
54.84
+0.325
0.6%
1 gen 1989 anni
55.164
+0.324
0.59%
1 gen 1990 anni
55.496
+0.332
0.6%
1 gen 1991 anni
55.781
+0.285
0.51%
1 gen 1992 anni
55.842
+0.062
0.11%
1 gen 1993 anni
55.757
-0.085
-0.15%
1 gen 1994 anni
55.579
-0.178
-0.32%
1 gen 1995 anni
55.361
-0.218
-0.39%
1 gen 1996 anni
55.135
-0.226
-0.41%
1 gen 1997 anni
55.195
+0.059
0.11%
1 gen 1998 anni
55.201
+0.007
0.01%
1 gen 1999 anni
55.146
-0.055
-0.1%
1 gen 2000 anni
55.01
-0.136
-0.25%
1 gen 2001 anni
54.805
-0.205
-0.37%
1 gen 2002 anni
55.1
+0.295
0.54%
1 gen 2003 anni
55.265
+0.165
0.3%
1 gen 2004 anni
55.363
+0.098
0.18%
1 gen 2005 anni
55.463
+0.1
0.18%
1 gen 2006 anni
55.594
+0.131
0.24%
1 gen 2007 anni
55.827
+0.233
0.42%
1 gen 2008 anni
56.049
+0.222
0.4%
1 gen 2009 anni
56.261
+0.212
0.38%
1 gen 2010 anni
56.467
+0.205
0.36%
1 gen 2011 anni
56.673
+0.207
0.37%
1 gen 2012 anni
56.704
+0.031
0.05%
1 gen 2013 anni
56.872
+0.168
0.3%
1 gen 2014 anni
57.109
+0.236
0.42%
1 gen 2015 anni
57.321
+0.212
0.37%
1 gen 2016 anni
57.476
+0.155
0.27%
Classificazione dei paesi secondo i statistiche attuali per anni


Commenti: