29
/it/
it
AIzaSyAYiBZKx7MnpbEhh9jyipgxe19OcubqV5w
April 1, 2024
266162
Tonga
TON
true
2
1
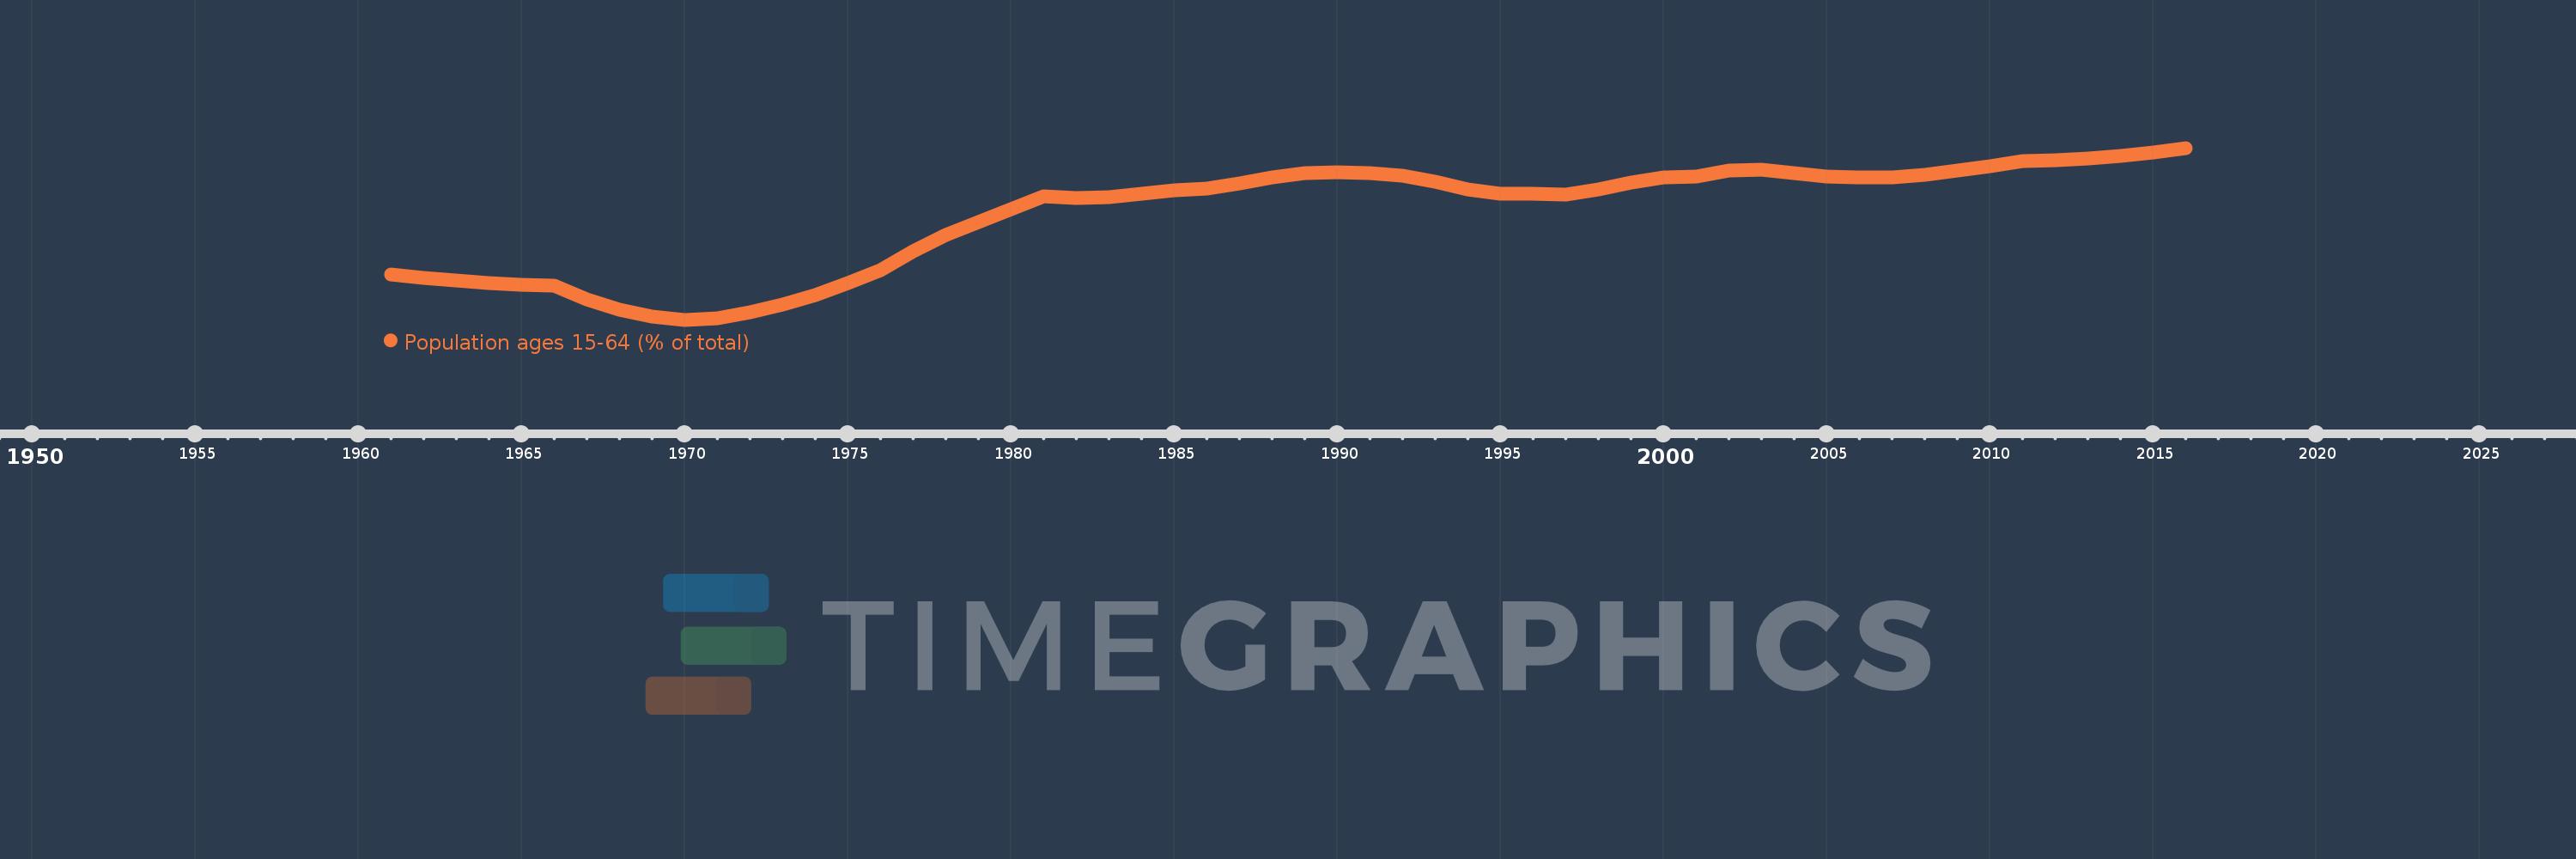
Population ages 15-64 (% of total)
2016,2015,2014,2013,2012,2011,2010,2009,2008,2007,2006,2005,2004,2003,2002,2001,2000,1999,1998,1997,1996,1995,1994,1993,1992,1991,1990,1989,1988,1987,1986,1985,1984,1983,1982,1981,1980,1979,1978,1977,1976,1975,1974,1973,1972,1971,1970,1969,1968,1967,1966,1965,1964,1963,1962,1961
Queste statistiche in altri paesi:
AfghanistanAlbaniaAlgeriaAngolaAntigua and BarbudaArab WorldArgentinaArmeniaArubaAustraliaAustriaAzerbaijanBahamas, TheBahrainBangladeshBarbadosBelarusBelgiumBelizeBeninBhutanBoliviaBosnia and HerzegovinaBotswanaBrazilBrunei DarussalamBulgariaBurkina FasoBurundiCabo VerdeCambodiaCameroonCanadaCaribbean small statesCentral African RepublicCentral Europe and the BalticsChadChannel IslandsChileChinaColombiaComorosCongo, Dem. Rep.Congo, Rep.Costa RicaCote d'IvoireCroatiaCubaCuracaoCyprusCzech RepublicDenmarkDjiboutiDominican RepublicEarly-demographic dividendEast Asia & PacificEast Asia & Pacific (excluding high income)East Asia & Pacific (IDA & IBRD countries)EcuadorEgypt, Arab Rep.El SalvadorEquatorial GuineaEritreaEstoniaEthiopiaEuro areaEurope & Central AsiaEurope & Central Asia (excluding high income)Europe & Central Asia (IDA & IBRD countries)European UnionFijiFinlandFragile and conflict affected situationsFranceFrench PolynesiaGabonGambia, TheGeorgiaGermanyGhanaGreeceGrenadaGuamGuatemalaGuineaGuinea-BissauGuyanaHaitiHeavily indebted poor countries (HIPC)High incomeHondurasHong Kong SAR, ChinaHungaryIBRD onlyIcelandIDA & IBRD totalIDA blendIDA onlyIDA totalIndiaIndonesiaIran, Islamic Rep.IraqIrelandIsraelItalyJamaicaJapanJordanKazakhstanKenyaKiribatiKorea, Dem. People’s Rep.Korea, Rep.KosovoKuwaitKyrgyz RepublicLao PDRLate-demographic dividendLatin America & Caribbean Latin America & Caribbean (excluding high income)Latin America & the Caribbean (IDA & IBRD countries)LatviaLeast developed countries: UN classificationLebanonLesothoLiberiaLibyaLithuaniaLow & middle incomeLow incomeLower middle incomeLuxembourgMacao SAR, ChinaMacedonia, FYRMadagascarMalawiMalaysiaMaldivesMaliMaltaMauritaniaMauritiusMexicoMicronesia, Fed. Sts.Middle East & North AfricaMiddle East & North Africa (excluding high income)Middle East & North Africa (IDA & IBRD countries)Middle incomeMoldovaMongoliaMontenegroMoroccoMozambiqueMyanmarNamibiaNepalNetherlandsNew CaledoniaNew ZealandNicaraguaNigerNigeriaNorth AmericaNorwayOECD membersOmanOther small statesPacific island small statesPakistanPanamaPapua New GuineaParaguayPeruPhilippinesPolandPortugalPost-demographic dividendPre-demographic dividendPuerto RicoQatarRomaniaRussian FederationRwandaSamoaSao Tome and PrincipeSaudi ArabiaSenegalSerbiaSeychellesSierra LeoneSingaporeSlovak RepublicSloveniaSmall statesSolomon IslandsSomaliaSouth AfricaSouth AsiaSouth Asia (IDA & IBRD)South SudanSpainSri LankaSt. LuciaSt. Vincent and the GrenadinesSub-Saharan Africa Sub-Saharan Africa (excluding high income)Sub-Saharan Africa (IDA & IBRD countries)SudanSurinameSwazilandSwedenSwitzerlandSyrian Arab RepublicTajikistanTanzaniaThailandTimor-LesteTogoTongaTrinidad and TobagoTunisiaTurkeyTurkmenistanUgandaUkraineUnited Arab EmiratesUnited KingdomUnited StatesUpper middle incomeUruguayUzbekistanVanuatuVenezuela, RBVietnamVirgin Islands (U.S.)West Bank and GazaWorldYemen, Rep.ZambiaZimbabwe Linea del tempo:
Questa scala temporale mostra un grafico dal 1961 anno al 2016 anno. Tonga. I dati fino ad 1960 anno non disponibili. Il numero di osservazioni attuali secondo i date: 56.
La fonte (nome):
Indicatori dello sviluppo mondiale
La fonte (organizzazione):
World Bank staff estimates based on age distributions of United Nations Population Division's World Population Prospects.
Categorie:
Education, Health
sono stati aggiornati
23 apr 2017 anni
Indicatori delle variazioni dei valori per anni
Minima:
48.94
1 gen 1970 anni
Massimo:
57.363
1 gen 2016 anni
Alla data di osservazione
Valore
Variazione assoluta
La variazione rispetto al valore precedente
1 gen 1961 anni
51.177
+51.177
0.0%
1 gen 1962 anni
50.985
-0.192
-0.37%
1 gen 1963 anni
50.861
-0.124
-0.24%
1 gen 1964 anni
50.759
-0.102
-0.2%
1 gen 1965 anni
50.675
-0.084
-0.17%
1 gen 1966 anni
50.629
-0.047
-0.09%
1 gen 1967 anni
49.955
-0.674
-1.33%
1 gen 1968 anni
49.435
-0.521
-1.04%
1 gen 1969 anni
49.086
-0.348
-0.7%
1 gen 1970 anni
48.94
-0.146
-0.3%
1 gen 1971 anni
49.019
+0.079
0.16%
1 gen 1972 anni
49.3
+0.281
0.57%
1 gen 1973 anni
49.672
+0.372
0.75%
1 gen 1974 anni
50.149
+0.477
0.96%
1 gen 1975 anni
50.723
+0.574
1.15%
1 gen 1976 anni
51.371
+0.648
1.28%
1 gen 1977 anni
52.299
+0.928
1.81%
1 gen 1978 anni
53.078
+0.779
1.49%
1 gen 1979 anni
53.739
+0.661
1.25%
1 gen 1980 anni
54.359
+0.62
1.15%
1 gen 1981 anni
55.001
+0.642
1.18%
1 gen 1982 anni
54.898
-0.104
-0.19%
1 gen 1983 anni
54.968
+0.071
0.13%
1 gen 1984 anni
55.136
+0.168
0.31%
1 gen 1985 anni
55.293
+0.157
0.28%
1 gen 1986 anni
55.385
+0.092
0.17%
1 gen 1987 anni
55.628
+0.243
0.44%
1 gen 1988 anni
55.899
+0.271
0.49%
1 gen 1989 anni
56.11
+0.211
0.38%
1 gen 1990 anni
56.187
+0.077
0.14%
1 gen 1991 anni
56.127
-0.06
-0.11%
1 gen 1992 anni
56.019
-0.108
-0.19%
1 gen 1993 anni
55.689
-0.33
-0.59%
1 gen 1994 anni
55.322
-0.367
-0.66%
1 gen 1995 anni
55.116
-0.206
-0.37%
1 gen 1996 anni
55.126
+0.01
0.02%
1 gen 1997 anni
55.096
-0.03
-0.05%
1 gen 1998 anni
55.337
+0.241
0.44%
1 gen 1999 anni
55.684
+0.346
0.63%
1 gen 2000 anni
55.921
+0.237
0.43%
1 gen 2001 anni
55.95
+0.029
0.05%
1 gen 2002 anni
56.259
+0.309
0.55%
1 gen 2003 anni
56.278
+0.019
0.03%
1 gen 2004 anni
56.123
-0.155
-0.28%
1 gen 2005 anni
55.969
-0.155
-0.28%
1 gen 2006 anni
55.913
-0.055
-0.1%
1 gen 2007 anni
55.935
+0.022
0.04%
1 gen 2008 anni
56.045
+0.11
0.2%
1 gen 2009 anni
56.242
+0.197
0.35%
1 gen 2010 anni
56.474
+0.232
0.41%
1 gen 2011 anni
56.707
+0.233
0.41%
1 gen 2012 anni
56.752
+0.046
0.08%
1 gen 2013 anni
56.84
+0.088
0.15%
1 gen 2014 anni
56.966
+0.126
0.22%
1 gen 2015 anni
57.142
+0.176
0.31%
1 gen 2016 anni
57.363
+0.221
0.39%
Classificazione dei paesi secondo i statistiche attuali per anni


Commenti: