29
/it/
it
AIzaSyAYiBZKx7MnpbEhh9jyipgxe19OcubqV5w
April 1, 2024
242012
Slovak Republic
SVK
true
2
1
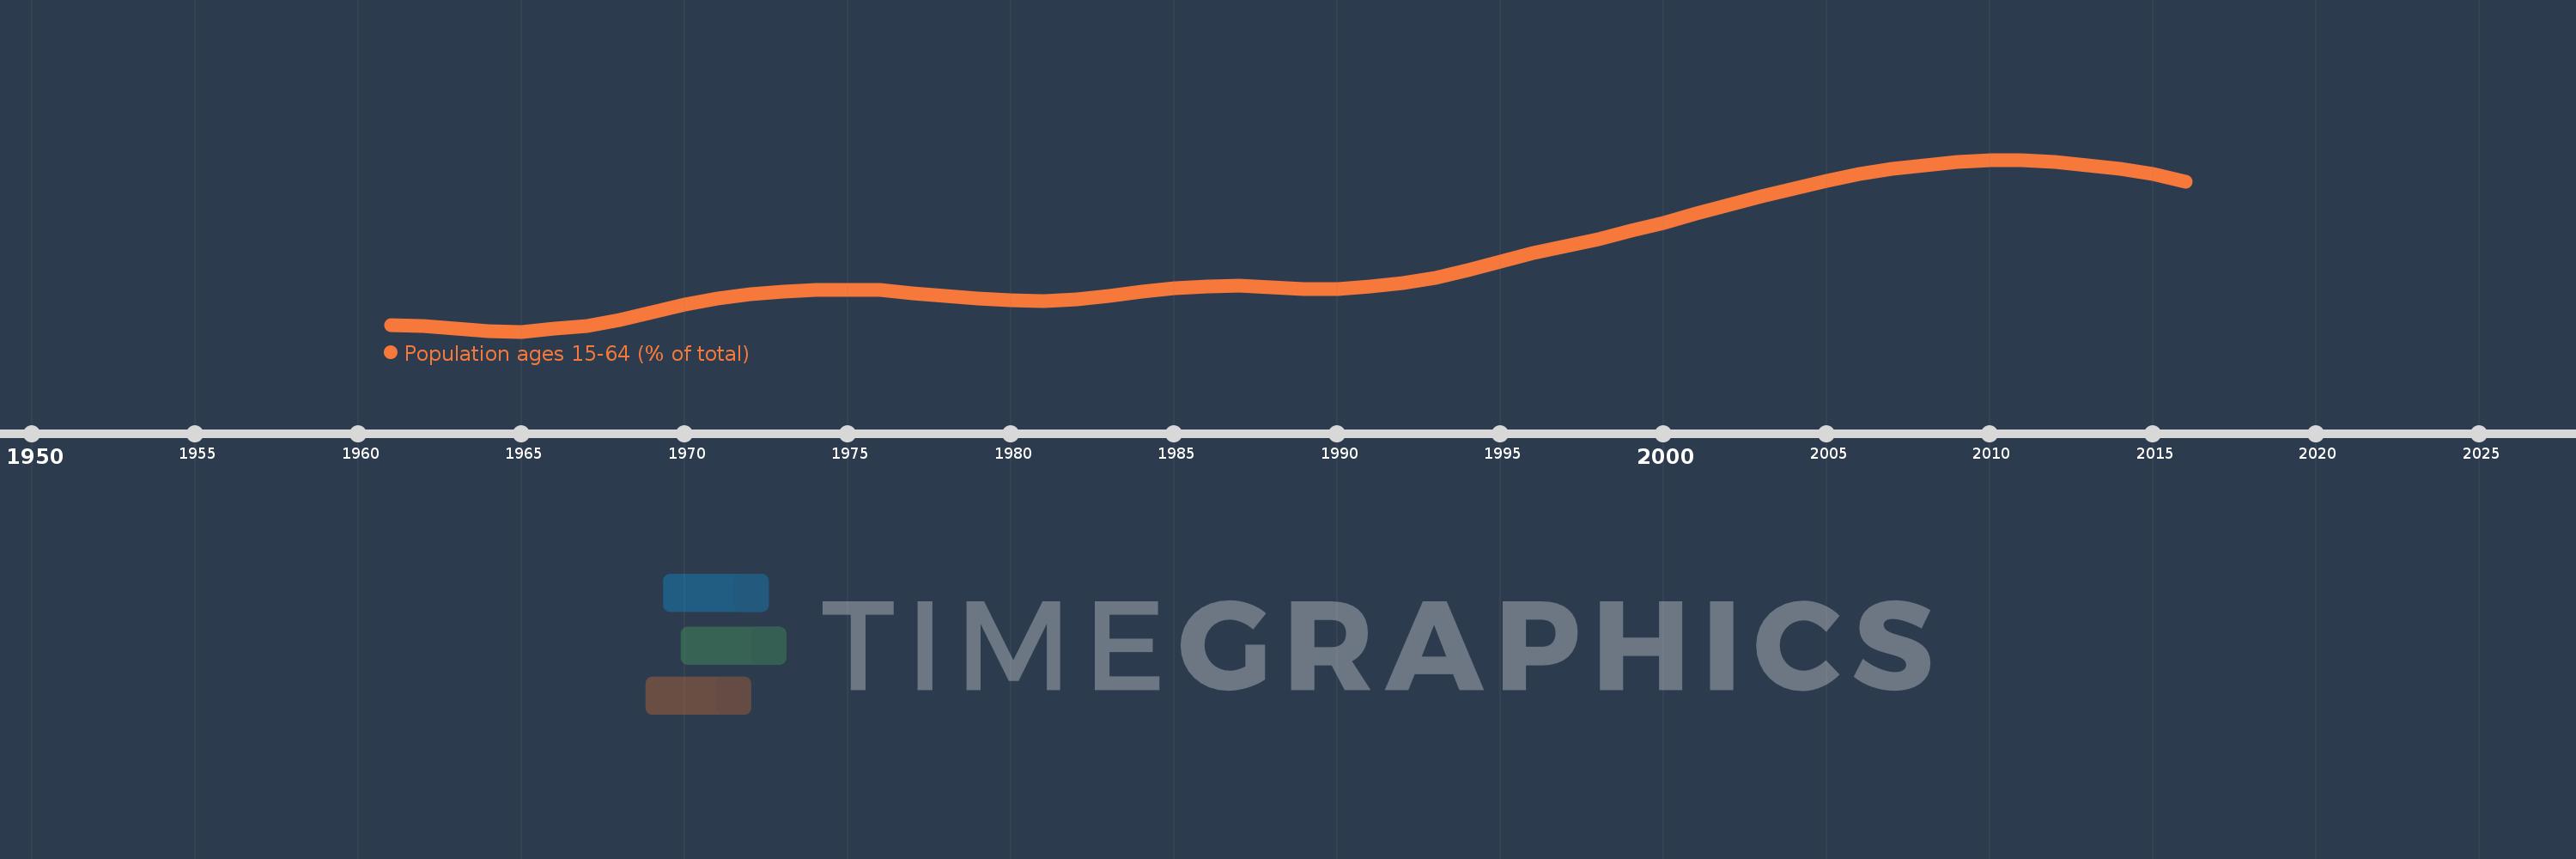
Population ages 15-64 (% of total)
2016,2015,2014,2013,2012,2011,2010,2009,2008,2007,2006,2005,2004,2003,2002,2001,2000,1999,1998,1997,1996,1995,1994,1993,1992,1991,1990,1989,1988,1987,1986,1985,1984,1983,1982,1981,1980,1979,1978,1977,1976,1975,1974,1973,1972,1971,1970,1969,1968,1967,1966,1965,1964,1963,1962,1961
Queste statistiche in altri paesi:
AfghanistanAlbaniaAlgeriaAngolaAntigua and BarbudaArab WorldArgentinaArmeniaArubaAustraliaAustriaAzerbaijanBahamas, TheBahrainBangladeshBarbadosBelarusBelgiumBelizeBeninBhutanBoliviaBosnia and HerzegovinaBotswanaBrazilBrunei DarussalamBulgariaBurkina FasoBurundiCabo VerdeCambodiaCameroonCanadaCaribbean small statesCentral African RepublicCentral Europe and the BalticsChadChannel IslandsChileChinaColombiaComorosCongo, Dem. Rep.Congo, Rep.Costa RicaCote d'IvoireCroatiaCubaCuracaoCyprusCzech RepublicDenmarkDjiboutiDominican RepublicEarly-demographic dividendEast Asia & PacificEast Asia & Pacific (excluding high income)East Asia & Pacific (IDA & IBRD countries)EcuadorEgypt, Arab Rep.El SalvadorEquatorial GuineaEritreaEstoniaEthiopiaEuro areaEurope & Central AsiaEurope & Central Asia (excluding high income)Europe & Central Asia (IDA & IBRD countries)European UnionFijiFinlandFragile and conflict affected situationsFranceFrench PolynesiaGabonGambia, TheGeorgiaGermanyGhanaGreeceGrenadaGuamGuatemalaGuineaGuinea-BissauGuyanaHaitiHeavily indebted poor countries (HIPC)High incomeHondurasHong Kong SAR, ChinaHungaryIBRD onlyIcelandIDA & IBRD totalIDA blendIDA onlyIDA totalIndiaIndonesiaIran, Islamic Rep.IraqIrelandIsraelItalyJamaicaJapanJordanKazakhstanKenyaKiribatiKorea, Dem. People’s Rep.Korea, Rep.KosovoKuwaitKyrgyz RepublicLao PDRLate-demographic dividendLatin America & Caribbean Latin America & Caribbean (excluding high income)Latin America & the Caribbean (IDA & IBRD countries)LatviaLeast developed countries: UN classificationLebanonLesothoLiberiaLibyaLithuaniaLow & middle incomeLow incomeLower middle incomeLuxembourgMacao SAR, ChinaMacedonia, FYRMadagascarMalawiMalaysiaMaldivesMaliMaltaMauritaniaMauritiusMexicoMicronesia, Fed. Sts.Middle East & North AfricaMiddle East & North Africa (excluding high income)Middle East & North Africa (IDA & IBRD countries)Middle incomeMoldovaMongoliaMontenegroMoroccoMozambiqueMyanmarNamibiaNepalNetherlandsNew CaledoniaNew ZealandNicaraguaNigerNigeriaNorth AmericaNorwayOECD membersOmanOther small statesPacific island small statesPakistanPanamaPapua New GuineaParaguayPeruPhilippinesPolandPortugalPost-demographic dividendPre-demographic dividendPuerto RicoQatarRomaniaRussian FederationRwandaSamoaSao Tome and PrincipeSaudi ArabiaSenegalSerbiaSeychellesSierra LeoneSingaporeSlovak RepublicSloveniaSmall statesSolomon IslandsSomaliaSouth AfricaSouth AsiaSouth Asia (IDA & IBRD)South SudanSpainSri LankaSt. LuciaSt. Vincent and the GrenadinesSub-Saharan Africa Sub-Saharan Africa (excluding high income)Sub-Saharan Africa (IDA & IBRD countries)SudanSurinameSwazilandSwedenSwitzerlandSyrian Arab RepublicTajikistanTanzaniaThailandTimor-LesteTogoTongaTrinidad and TobagoTunisiaTurkeyTurkmenistanUgandaUkraineUnited Arab EmiratesUnited KingdomUnited StatesUpper middle incomeUruguayUzbekistanVanuatuVenezuela, RBVietnamVirgin Islands (U.S.)West Bank and GazaWorldYemen, Rep.ZambiaZimbabwe Linea del tempo:
Questa scala temporale mostra un grafico dal 1961 anno al 2016 anno. Slovak Republic. I dati fino ad 1960 anno non disponibili. Il numero di osservazioni attuali secondo i date: 56.
La fonte (nome):
Indicatori dello sviluppo mondiale
La fonte (organizzazione):
World Bank staff estimates based on age distributions of United Nations Population Division's World Population Prospects.
Categorie:
Education, Health
sono stati aggiornati
23 apr 2017 anni
Indicatori delle variazioni dei valori per anni
Minima:
61.375
1 gen 1965 anni
Massimo:
72.412
1 gen 2011 anni
Alla data di osservazione
Valore
Variazione assoluta
La variazione rispetto al valore precedente
1 gen 1961 anni
61.796
+61.796
0.0%
1 gen 1962 anni
61.753
-0.043
-0.07%
1 gen 1963 anni
61.588
-0.166
-0.27%
1 gen 1964 anni
61.41
-0.178
-0.29%
1 gen 1965 anni
61.375
-0.034
-0.06%
1 gen 1966 anni
61.55
+0.175
0.28%
1 gen 1967 anni
61.731
+0.181
0.29%
1 gen 1968 anni
62.117
+0.386
0.62%
1 gen 1969 anni
62.63
+0.513
0.83%
1 gen 1970 anni
63.121
+0.491
0.78%
1 gen 1971 anni
63.496
+0.375
0.59%
1 gen 1972 anni
63.791
+0.294
0.46%
1 gen 1973 anni
63.963
+0.173
0.27%
1 gen 1974 anni
64.037
+0.073
0.11%
1 gen 1975 anni
64.06
+0.024
0.04%
1 gen 1976 anni
64.057
-0.004
-0.01%
1 gen 1977 anni
63.85
-0.207
-0.32%
1 gen 1978 anni
63.649
-0.2
-0.31%
1 gen 1979 anni
63.473
-0.177
-0.28%
1 gen 1980 anni
63.363
-0.11
-0.17%
1 gen 1981 anni
63.355
-0.008
-0.01%
1 gen 1982 anni
63.456
+0.101
0.16%
1 gen 1983 anni
63.687
+0.231
0.36%
1 gen 1984 anni
63.966
+0.279
0.44%
1 gen 1985 anni
64.184
+0.218
0.34%
1 gen 1986 anni
64.287
+0.103
0.16%
1 gen 1987 anni
64.309
+0.022
0.03%
1 gen 1988 anni
64.211
-0.098
-0.15%
1 gen 1989 anni
64.099
-0.112
-0.17%
1 gen 1990 anni
64.106
+0.007
0.01%
1 gen 1991 anni
64.294
+0.188
0.29%
1 gen 1992 anni
64.477
+0.183
0.29%
1 gen 1993 anni
64.841
+0.364
0.56%
1 gen 1994 anni
65.331
+0.49
0.76%
1 gen 1995 anni
65.868
+0.537
0.82%
1 gen 1996 anni
66.408
+0.541
0.82%
1 gen 1997 anni
66.848
+0.439
0.66%
1 gen 1998 anni
67.324
+0.476
0.71%
1 gen 1999 anni
67.832
+0.508
0.75%
1 gen 2000 anni
68.374
+0.542
0.8%
1 gen 2001 anni
68.945
+0.571
0.83%
1 gen 2002 anni
69.522
+0.577
0.84%
1 gen 2003 anni
70.067
+0.545
0.78%
1 gen 2004 anni
70.581
+0.515
0.73%
1 gen 2005 anni
71.067
+0.486
0.69%
1 gen 2006 anni
71.515
+0.448
0.63%
1 gen 2007 anni
71.812
+0.296
0.41%
1 gen 2008 anni
72.059
+0.247
0.34%
1 gen 2009 anni
72.249
+0.19
0.26%
1 gen 2010 anni
72.37
+0.121
0.17%
1 gen 2011 anni
72.412
+0.042
0.06%
1 gen 2012 anni
72.251
-0.161
-0.22%
1 gen 2013 anni
72.068
-0.183
-0.25%
1 gen 2014 anni
71.825
-0.243
-0.34%
1 gen 2015 anni
71.48
-0.345
-0.48%
1 gen 2016 anni
71.031
-0.449
-0.63%
Classificazione dei paesi secondo i statistiche attuali per anni


Commenti: