29
/it/
it
AIzaSyAYiBZKx7MnpbEhh9jyipgxe19OcubqV5w
April 1, 2024
213452
Nigeria
NGA
true
2
1
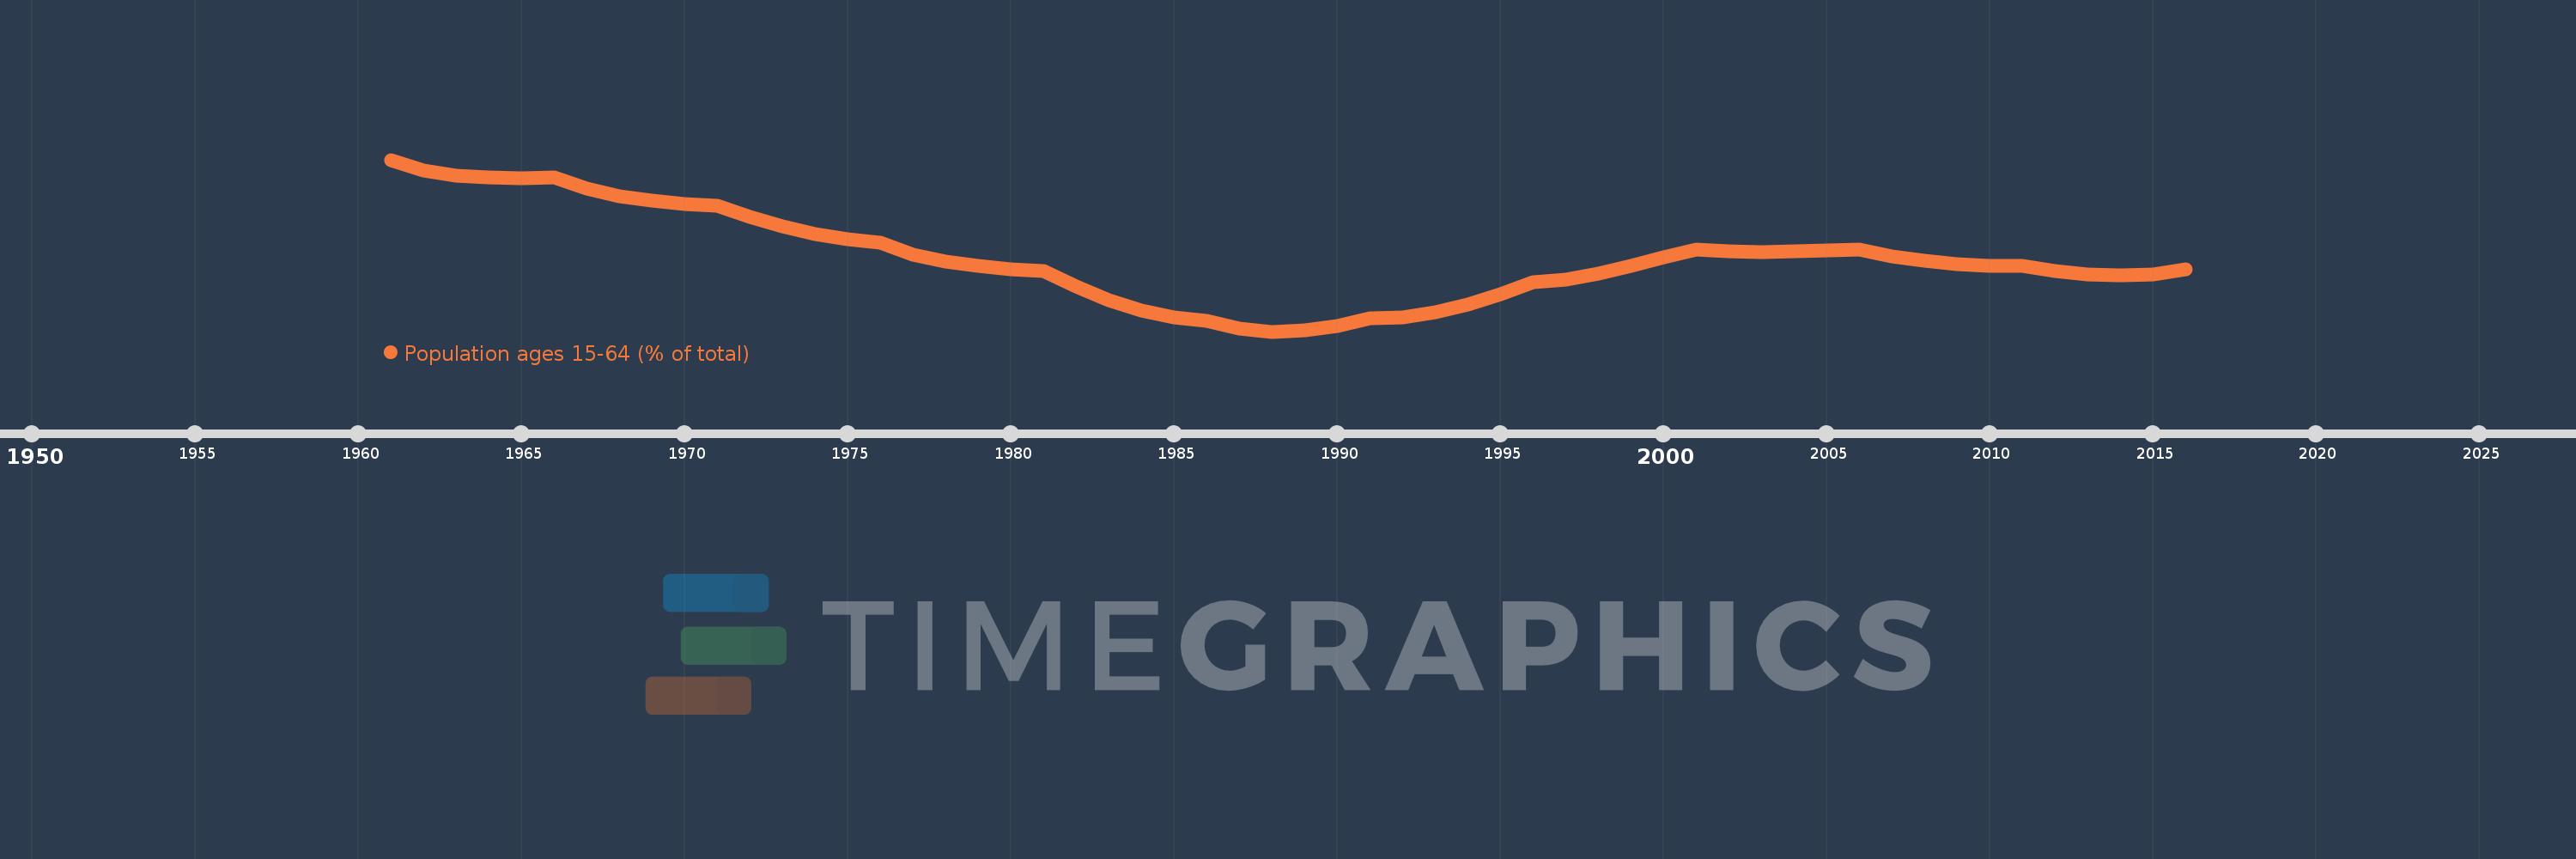
Population ages 15-64 (% of total)
2016,2015,2014,2013,2012,2011,2010,2009,2008,2007,2006,2005,2004,2003,2002,2001,2000,1999,1998,1997,1996,1995,1994,1993,1992,1991,1990,1989,1988,1987,1986,1985,1984,1983,1982,1981,1980,1979,1978,1977,1976,1975,1974,1973,1972,1971,1970,1969,1968,1967,1966,1965,1964,1963,1962,1961
Queste statistiche in altri paesi:
AfghanistanAlbaniaAlgeriaAngolaAntigua and BarbudaArab WorldArgentinaArmeniaArubaAustraliaAustriaAzerbaijanBahamas, TheBahrainBangladeshBarbadosBelarusBelgiumBelizeBeninBhutanBoliviaBosnia and HerzegovinaBotswanaBrazilBrunei DarussalamBulgariaBurkina FasoBurundiCabo VerdeCambodiaCameroonCanadaCaribbean small statesCentral African RepublicCentral Europe and the BalticsChadChannel IslandsChileChinaColombiaComorosCongo, Dem. Rep.Congo, Rep.Costa RicaCote d'IvoireCroatiaCubaCuracaoCyprusCzech RepublicDenmarkDjiboutiDominican RepublicEarly-demographic dividendEast Asia & PacificEast Asia & Pacific (excluding high income)East Asia & Pacific (IDA & IBRD countries)EcuadorEgypt, Arab Rep.El SalvadorEquatorial GuineaEritreaEstoniaEthiopiaEuro areaEurope & Central AsiaEurope & Central Asia (excluding high income)Europe & Central Asia (IDA & IBRD countries)European UnionFijiFinlandFragile and conflict affected situationsFranceFrench PolynesiaGabonGambia, TheGeorgiaGermanyGhanaGreeceGrenadaGuamGuatemalaGuineaGuinea-BissauGuyanaHaitiHeavily indebted poor countries (HIPC)High incomeHondurasHong Kong SAR, ChinaHungaryIBRD onlyIcelandIDA & IBRD totalIDA blendIDA onlyIDA totalIndiaIndonesiaIran, Islamic Rep.IraqIrelandIsraelItalyJamaicaJapanJordanKazakhstanKenyaKiribatiKorea, Dem. People’s Rep.Korea, Rep.KosovoKuwaitKyrgyz RepublicLao PDRLate-demographic dividendLatin America & Caribbean Latin America & Caribbean (excluding high income)Latin America & the Caribbean (IDA & IBRD countries)LatviaLeast developed countries: UN classificationLebanonLesothoLiberiaLibyaLithuaniaLow & middle incomeLow incomeLower middle incomeLuxembourgMacao SAR, ChinaMacedonia, FYRMadagascarMalawiMalaysiaMaldivesMaliMaltaMauritaniaMauritiusMexicoMicronesia, Fed. Sts.Middle East & North AfricaMiddle East & North Africa (excluding high income)Middle East & North Africa (IDA & IBRD countries)Middle incomeMoldovaMongoliaMontenegroMoroccoMozambiqueMyanmarNamibiaNepalNetherlandsNew CaledoniaNew ZealandNicaraguaNigerNigeriaNorth AmericaNorwayOECD membersOmanOther small statesPacific island small statesPakistanPanamaPapua New GuineaParaguayPeruPhilippinesPolandPortugalPost-demographic dividendPre-demographic dividendPuerto RicoQatarRomaniaRussian FederationRwandaSamoaSao Tome and PrincipeSaudi ArabiaSenegalSerbiaSeychellesSierra LeoneSingaporeSlovak RepublicSloveniaSmall statesSolomon IslandsSomaliaSouth AfricaSouth AsiaSouth Asia (IDA & IBRD)South SudanSpainSri LankaSt. LuciaSt. Vincent and the GrenadinesSub-Saharan Africa Sub-Saharan Africa (excluding high income)Sub-Saharan Africa (IDA & IBRD countries)SudanSurinameSwazilandSwedenSwitzerlandSyrian Arab RepublicTajikistanTanzaniaThailandTimor-LesteTogoTongaTrinidad and TobagoTunisiaTurkeyTurkmenistanUgandaUkraineUnited Arab EmiratesUnited KingdomUnited StatesUpper middle incomeUruguayUzbekistanVanuatuVenezuela, RBVietnamVirgin Islands (U.S.)West Bank and GazaWorldYemen, Rep.ZambiaZimbabwe Linea del tempo:
Questa scala temporale mostra un grafico dal 1961 anno al 2016 anno. Nigeria. I dati fino ad 1960 anno non disponibili. Il numero di osservazioni attuali secondo i date: 56.
La fonte (nome):
Indicatori dello sviluppo mondiale
La fonte (organizzazione):
World Bank staff estimates based on age distributions of United Nations Population Division's World Population Prospects.
Categorie:
Education, Health
sono stati aggiornati
23 apr 2017 anni
Indicatori delle variazioni dei valori per anni
Minima:
51.982
1 gen 1988 anni
Massimo:
55.562
1 gen 1961 anni
Alla data di osservazione
Valore
Variazione assoluta
La variazione rispetto al valore precedente
1 gen 1961 anni
55.562
+55.562
0.0%
1 gen 1962 anni
55.347
-0.215
-0.39%
1 gen 1963 anni
55.233
-0.114
-0.21%
1 gen 1964 anni
55.187
-0.046
-0.08%
1 gen 1965 anni
55.179
-0.008
-0.01%
1 gen 1966 anni
55.196
+0.016
0.03%
1 gen 1967 anni
54.967
-0.228
-0.41%
1 gen 1968 anni
54.81
-0.158
-0.29%
1 gen 1969 anni
54.706
-0.104
-0.19%
1 gen 1970 anni
54.641
-0.065
-0.12%
1 gen 1971 anni
54.604
-0.037
-0.07%
1 gen 1972 anni
54.366
-0.238
-0.44%
1 gen 1973 anni
54.172
-0.194
-0.36%
1 gen 1974 anni
54.019
-0.153
-0.28%
1 gen 1975 anni
53.907
-0.112
-0.21%
1 gen 1976 anni
53.828
-0.079
-0.15%
1 gen 1977 anni
53.586
-0.241
-0.45%
1 gen 1978 anni
53.435
-0.151
-0.28%
1 gen 1979 anni
53.343
-0.092
-0.17%
1 gen 1980 anni
53.284
-0.06
-0.11%
1 gen 1981 anni
53.247
-0.037
-0.07%
1 gen 1982 anni
52.913
-0.334
-0.63%
1 gen 1983 anni
52.64
-0.274
-0.52%
1 gen 1984 anni
52.426
-0.213
-0.41%
1 gen 1985 anni
52.28
-0.147
-0.28%
1 gen 1986 anni
52.203
-0.077
-0.15%
1 gen 1987 anni
52.043
-0.16
-0.31%
1 gen 1988 anni
51.982
-0.061
-0.12%
1 gen 1989 anni
52.007
+0.024
0.05%
1 gen 1990 anni
52.101
+0.094
0.18%
1 gen 1991 anni
52.255
+0.154
0.3%
1 gen 1992 anni
52.282
+0.027
0.05%
1 gen 1993 anni
52.383
+0.101
0.19%
1 gen 1994 anni
52.546
+0.163
0.31%
1 gen 1995 anni
52.757
+0.211
0.4%
1 gen 1996 anni
53.003
+0.246
0.47%
1 gen 1997 anni
53.071
+0.068
0.13%
1 gen 1998 anni
53.193
+0.122
0.23%
1 gen 1999 anni
53.351
+0.158
0.3%
1 gen 2000 anni
53.523
+0.172
0.32%
1 gen 2001 anni
53.693
+0.171
0.32%
1 gen 2002 anni
53.652
-0.042
-0.08%
1 gen 2003 anni
53.64
-0.012
-0.02%
1 gen 2004 anni
53.648
+0.008
0.02%
1 gen 2005 anni
53.669
+0.02
0.04%
1 gen 2006 anni
53.696
+0.028
0.05%
1 gen 2007 anni
53.554
-0.142
-0.26%
1 gen 2008 anni
53.458
-0.096
-0.18%
1 gen 2009 anni
53.396
-0.062
-0.12%
1 gen 2010 anni
53.36
-0.037
-0.07%
1 gen 2011 anni
53.343
-0.016
-0.03%
1 gen 2012 anni
53.241
-0.102
-0.19%
1 gen 2013 anni
53.173
-0.069
-0.13%
1 gen 2014 anni
53.147
-0.026
-0.05%
1 gen 2015 anni
53.179
+0.032
0.06%
1 gen 2016 anni
53.274
+0.095
0.18%
Classificazione dei paesi secondo i statistiche attuali per anni


Commenti: