29
/it/
it
AIzaSyAYiBZKx7MnpbEhh9jyipgxe19OcubqV5w
April 1, 2024
60959
Sub-Saharan Africa (IDA & IBRD countries)
TSS
false
2
1
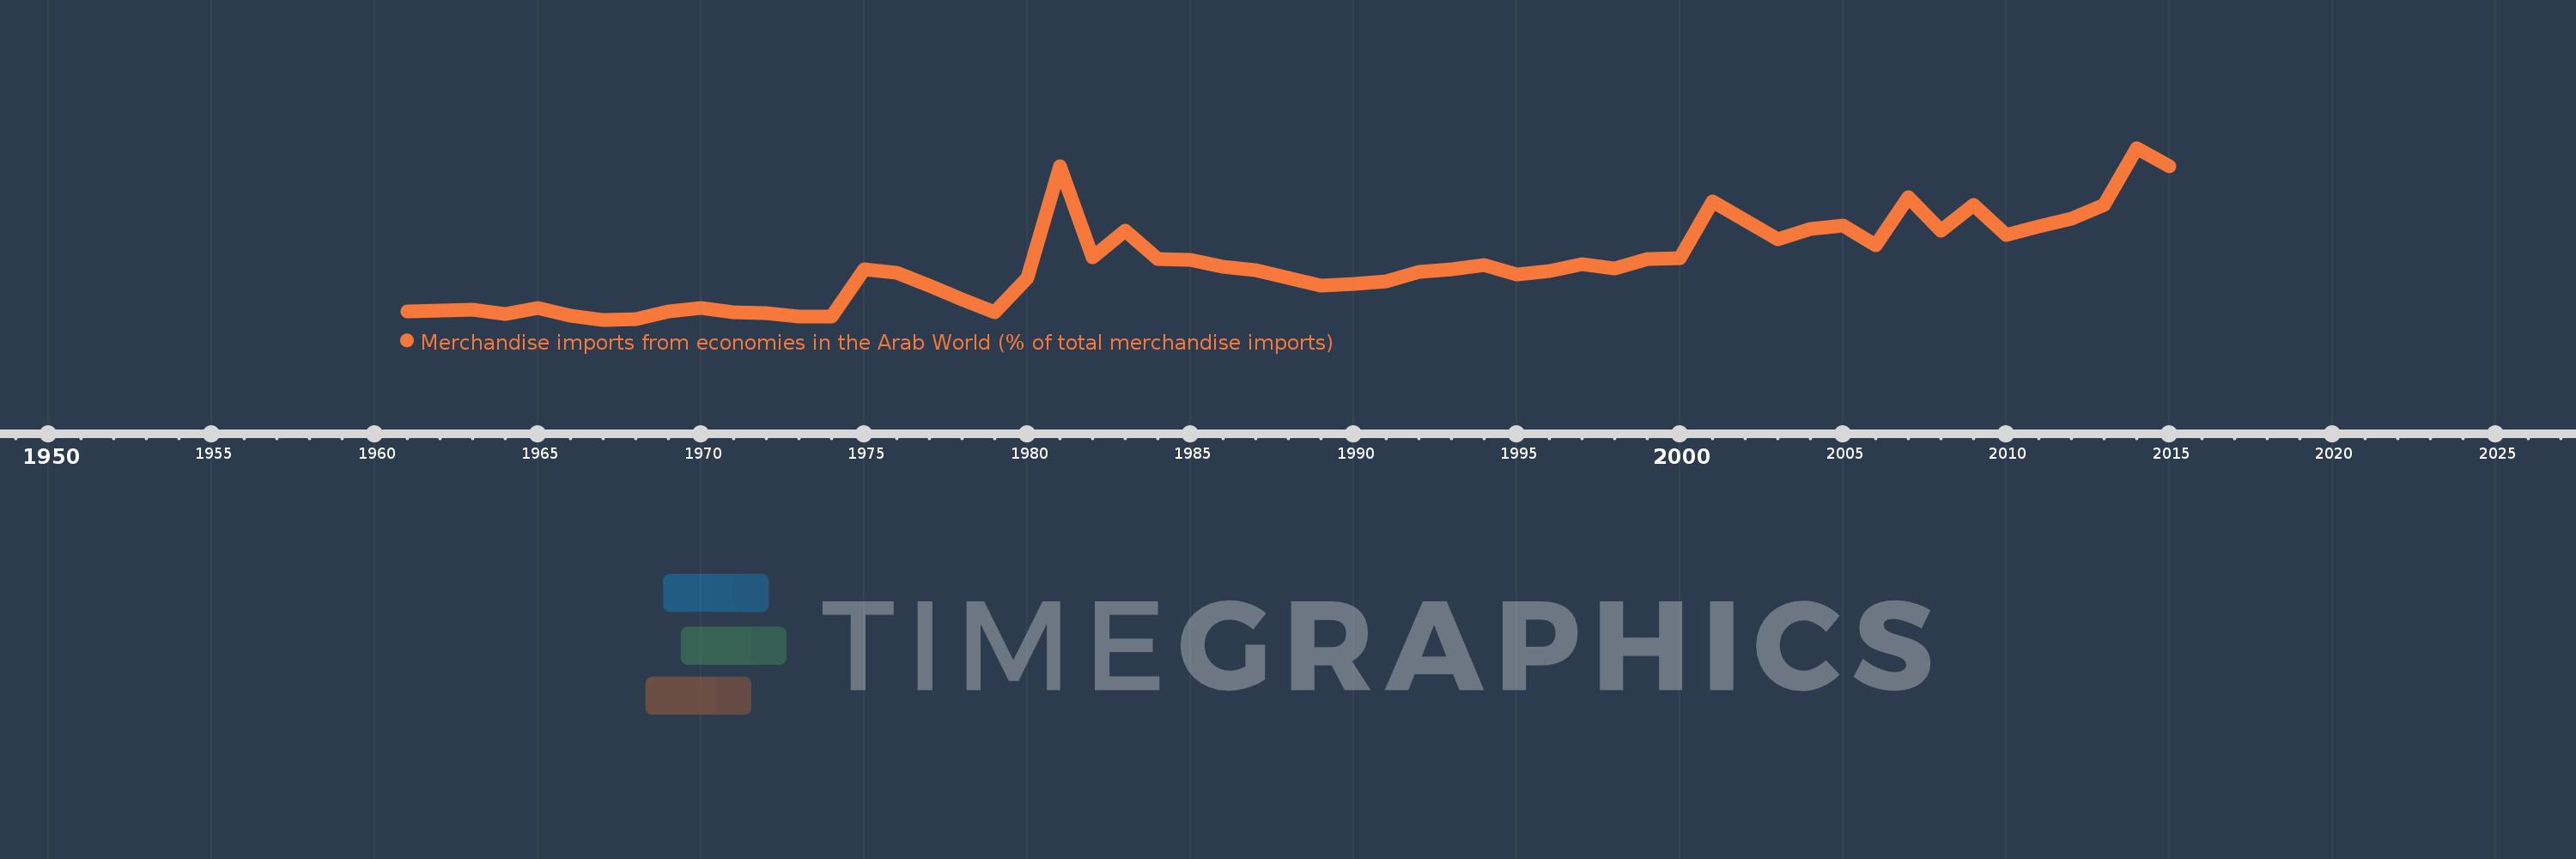
Merchandise imports from economies in the Arab World (% of total merchandise imports)
2015,2014,2013,2012,2011,2010,2009,2008,2007,2006,2005,2004,2003,2002,2001,2000,1999,1998,1997,1996,1995,1994,1993,1992,1991,1990,1989,1988,1987,1986,1985,1984,1983,1982,1981,1980,1979,1978,1977,1976,1975,1974,1973,1972,1971,1970,1969,1968,1967,1966,1965,1964,1963,1962,1961
Queste statistiche in altri paesi:
AfghanistanAlbaniaAlgeriaAngolaArab WorldArgentinaArmeniaArubaAustraliaAustriaAzerbaijanBahamas, TheBahrainBangladeshBarbadosBelarusBelgiumBelizeBeninBermudaBoliviaBrazilBrunei DarussalamBulgariaBurkina FasoBurundiCabo VerdeCambodiaCameroonCanadaCaribbean small statesCentral African RepublicCentral Europe and the BalticsChadChileChinaColombiaComorosCongo, Dem. Rep.Congo, Rep.Costa RicaCote d'IvoireCroatiaCubaCyprusCzech RepublicDenmarkDjiboutiDominicaDominican RepublicEarly-demographic dividendEast Asia & PacificEast Asia & Pacific (excluding high income)East Asia & Pacific (IDA & IBRD countries)EcuadorEgypt, Arab Rep.El SalvadorEstoniaEthiopiaEuro areaEurope & Central AsiaEurope & Central Asia (excluding high income)Europe & Central Asia (IDA & IBRD countries)European UnionFijiFinlandFragile and conflict affected situationsFranceFrench PolynesiaGabonGambia, TheGeorgiaGermanyGhanaGreeceGreenlandGrenadaGuatemalaGuineaGuinea-BissauGuyanaHaitiHeavily indebted poor countries (HIPC)High incomeHondurasHong Kong SAR, ChinaHungaryIBRD onlyIcelandIDA & IBRD totalIDA blendIDA onlyIDA totalIndiaIndonesiaIran, Islamic Rep.IraqIrelandItalyJamaicaJapanJordanKazakhstanKenyaKorea, Dem. People’s Rep.Korea, Rep.KuwaitKyrgyz RepublicLao PDRLate-demographic dividendLatin America & Caribbean Latin America & Caribbean (excluding high income)Latin America & the Caribbean (IDA & IBRD countries)LatviaLeast developed countries: UN classificationLebanonLiberiaLibyaLithuaniaLow & middle incomeLow incomeLower middle incomeLuxembourgMacao SAR, ChinaMacedonia, FYRMadagascarMalawiMalaysiaMaldivesMaliMaltaMauritaniaMauritiusMexicoMiddle East & North AfricaMiddle East & North Africa (excluding high income)Middle East & North Africa (IDA & IBRD countries)Middle incomeMoldovaMongoliaMontenegroMoroccoMozambiqueMyanmarNepalNetherlandsNew CaledoniaNew ZealandNicaraguaNigerNigeriaNorth AmericaNorwayOECD membersOmanOther small statesPacific island small statesPakistanPanamaPapua New GuineaParaguayPeruPhilippinesPolandPortugalPost-demographic dividendPre-demographic dividendQatarRomaniaRussian FederationRwandaSaudi ArabiaSenegalSerbiaSeychellesSierra LeoneSingaporeSlovak RepublicSloveniaSmall statesSomaliaSouth AfricaSouth AsiaSouth Asia (IDA & IBRD)SpainSri LankaSt. LuciaSt. Vincent and the GrenadinesSub-Saharan Africa Sub-Saharan Africa (excluding high income)Sub-Saharan Africa (IDA & IBRD countries)SudanSurinameSwedenSwitzerlandSyrian Arab RepublicTajikistanTanzaniaThailandTogoTrinidad and TobagoTunisiaTurkeyTurkmenistanUgandaUkraineUnited Arab EmiratesUnited KingdomUnited StatesUpper middle incomeUruguayVenezuela, RBVietnamWorldYemen, Rep.ZambiaZimbabwe Linea del tempo:
Questa scala temporale mostra un grafico dal 1961 anno al 2015 anno. Sub-Saharan Africa (IDA & IBRD countries). I dati fino ad 1960 anno non disponibili. Il numero di osservazioni attuali secondo i date: 55.
La fonte (nome):
Indicatori dello sviluppo mondiale
La fonte (organizzazione):
World Bank staff estimates based data from International Monetary Fund's Direction of Trade database.
Categorie:
Private Sector, Trade
sono stati aggiornati
23 apr 2017 anni
Indicatori delle variazioni dei valori per anni
Minima:
1.632
1 gen 1967 anni
Massimo:
10.447
1 gen 2014 anni
Alla data di osservazione
Valore
Variazione assoluta
La variazione rispetto al valore precedente
1 gen 1961 anni
2.043
+2.043
0.0%
1 gen 1962 anni
2.093
+0.05
2.43%
1 gen 1963 anni
2.137
+0.044
2.09%
1 gen 1964 anni
1.935
-0.201
-9.43%
1 gen 1965 anni
2.243
+0.308
15.9%
1 gen 1966 anni
1.823
-0.42
-18.72%
1 gen 1967 anni
1.632
-0.191
-10.47%
1 gen 1968 anni
1.657
+0.024
1.5%
1 gen 1969 anni
2.042
+0.385
23.25%
1 gen 1970 anni
2.226
+0.185
9.04%
1 gen 1971 anni
2.017
-0.209
-9.4%
1 gen 1972 anni
1.977
-0.04
-2.0%
1 gen 1973 anni
1.775
-0.202
-10.21%
1 gen 1974 anni
1.813
+0.037
2.11%
1 gen 1975 anni
4.24
+2.428
133.93%
1 gen 1976 anni
4.04
-0.2
-4.72%
1 gen 1977 anni
3.393
-0.647
-16.01%
1 gen 1978 anni
2.685
-0.709
-20.88%
1 gen 1979 anni
2.017
-0.667
-24.85%
1 gen 1980 anni
3.79
+1.772
87.84%
1 gen 1981 anni
9.525
+5.736
151.35%
1 gen 1982 anni
4.827
-4.698
-49.33%
1 gen 1983 anni
6.196
+1.369
28.36%
1 gen 1984 anni
4.739
-1.456
-23.51%
1 gen 1985 anni
4.721
-0.018
-0.38%
1 gen 1986 anni
4.354
-0.367
-7.78%
1 gen 1987 anni
4.177
-0.176
-4.05%
1 gen 1988 anni
3.785
-0.393
-9.4%
1 gen 1989 anni
3.362
-0.422
-11.16%
1 gen 1990 anni
3.45
+0.088
2.61%
1 gen 1991 anni
3.612
+0.162
4.7%
1 gen 1992 anni
4.091
+0.479
13.26%
1 gen 1993 anni
4.202
+0.111
2.71%
1 gen 1994 anni
4.445
+0.242
5.77%
1 gen 1995 anni
3.958
-0.487
-10.96%
1 gen 1996 anni
4.15
+0.192
4.85%
1 gen 1997 anni
4.485
+0.335
8.07%
1 gen 1998 anni
4.275
-0.209
-4.67%
1 gen 1999 anni
4.745
+0.469
10.98%
1 gen 2000 anni
4.777
+0.032
0.67%
1 gen 2001 anni
7.716
+2.94
61.54%
1 gen 2002 anni
6.726
-0.99
-12.83%
1 gen 2003 anni
5.781
-0.945
-14.06%
1 gen 2004 anni
6.308
+0.527
9.12%
1 gen 2005 anni
6.473
+0.165
2.62%
1 gen 2006 anni
5.434
-1.039
-16.06%
1 gen 2007 anni
7.904
+2.47
45.45%
1 gen 2008 anni
6.19
-1.714
-21.68%
1 gen 2009 anni
7.542
+1.351
21.83%
1 gen 2010 anni
5.985
-1.557
-20.65%
1 gen 2011 anni
6.417
+0.433
7.23%
1 gen 2012 anni
6.84
+0.422
6.58%
1 gen 2013 anni
7.523
+0.683
9.99%
1 gen 2014 anni
10.447
+2.924
38.87%
1 gen 2015 anni
9.498
-0.949
-9.08%
Classificazione dei paesi secondo i statistiche attuali per anni


Commenti: