29
/it/
it
AIzaSyAYiBZKx7MnpbEhh9jyipgxe19OcubqV5w
April 1, 2024
272540
Uganda
UGA
true
2
1
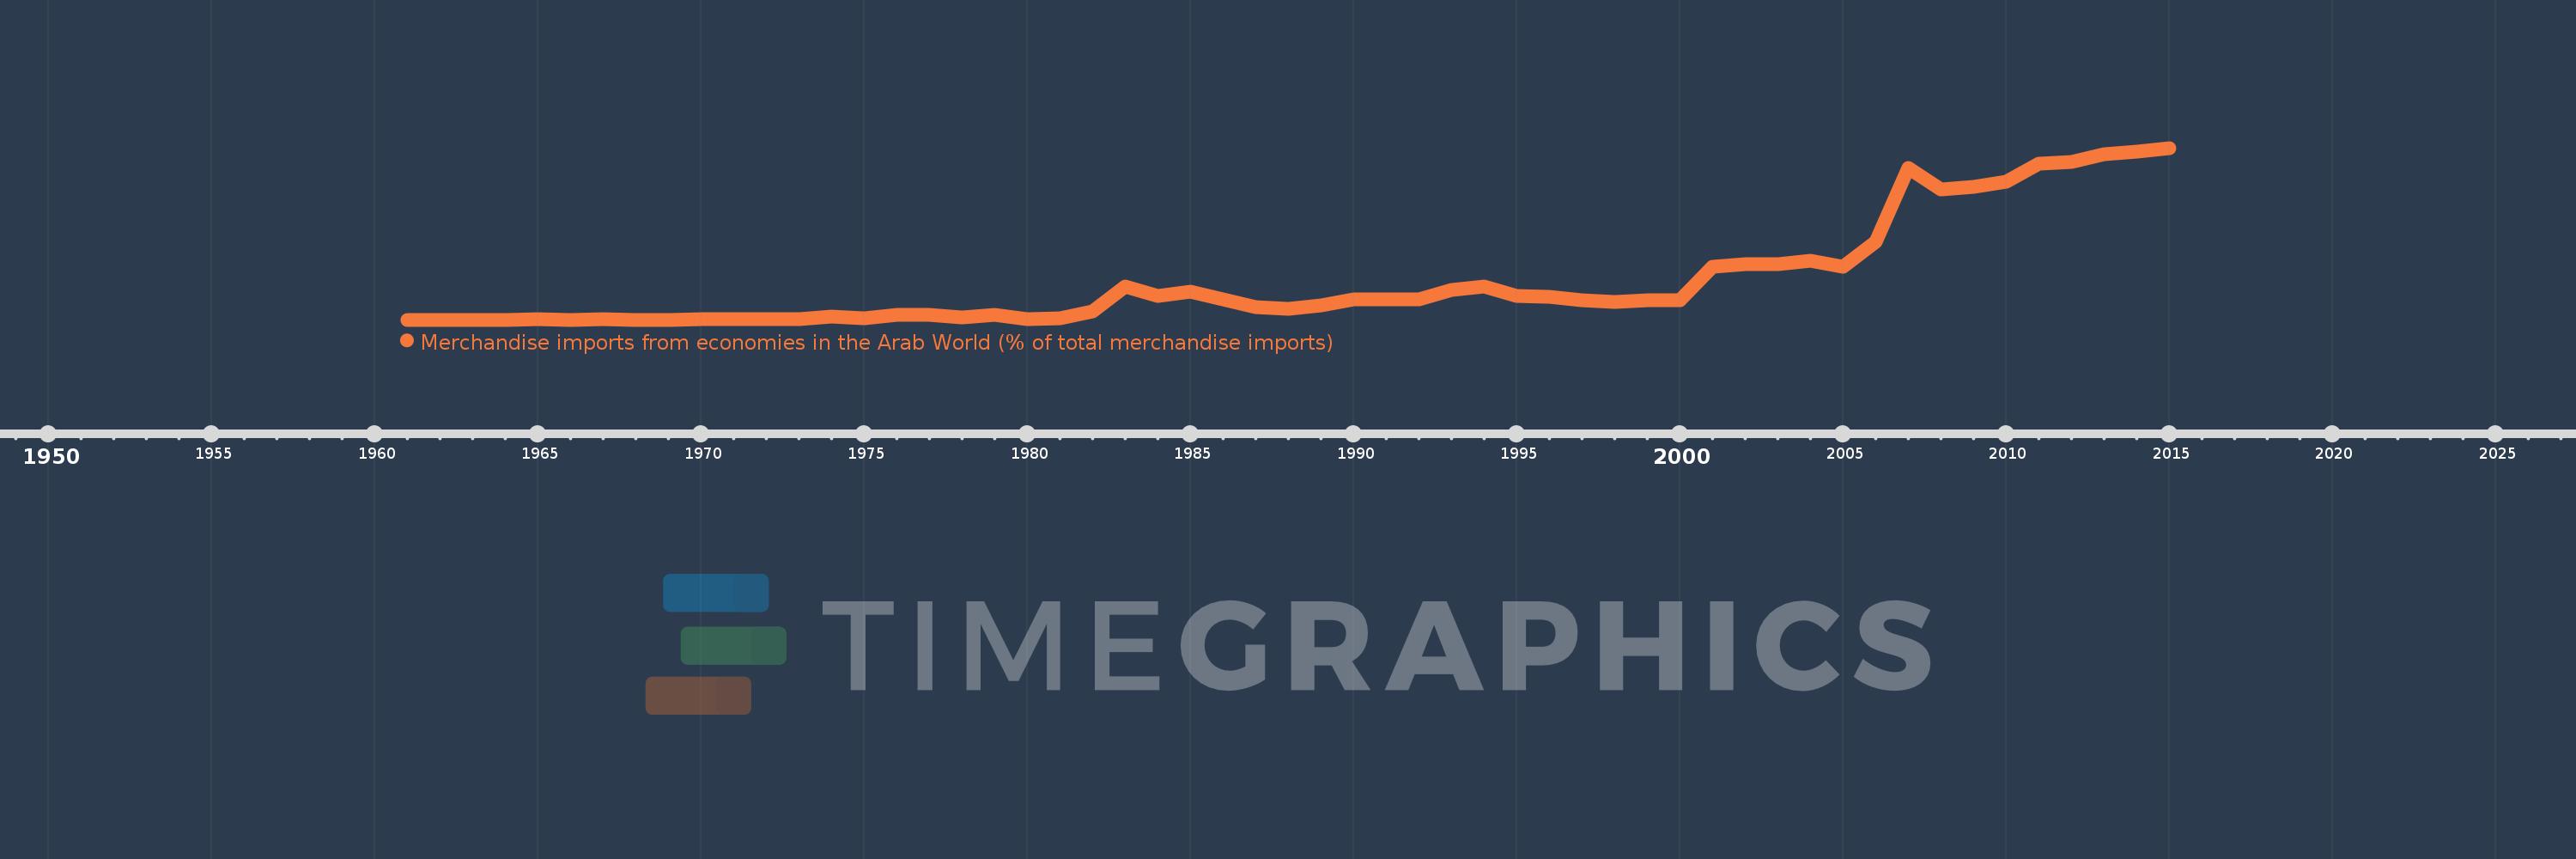
Merchandise imports from economies in the Arab World (% of total merchandise imports)
2015,2014,2013,2012,2011,2010,2009,2008,2007,2006,2005,2004,2003,2002,2001,2000,1999,1998,1997,1996,1995,1994,1993,1992,1991,1990,1989,1988,1987,1986,1985,1984,1983,1982,1981,1980,1979,1978,1977,1976,1975,1974,1973,1972,1971,1970,1969,1968,1967,1966,1965,1964,1963,1962,1961
Queste statistiche in altri paesi:
AfghanistanAlbaniaAlgeriaAngolaArab WorldArgentinaArmeniaArubaAustraliaAustriaAzerbaijanBahamas, TheBahrainBangladeshBarbadosBelarusBelgiumBelizeBeninBermudaBoliviaBrazilBrunei DarussalamBulgariaBurkina FasoBurundiCabo VerdeCambodiaCameroonCanadaCaribbean small statesCentral African RepublicCentral Europe and the BalticsChadChileChinaColombiaComorosCongo, Dem. Rep.Congo, Rep.Costa RicaCote d'IvoireCroatiaCubaCyprusCzech RepublicDenmarkDjiboutiDominicaDominican RepublicEarly-demographic dividendEast Asia & PacificEast Asia & Pacific (excluding high income)East Asia & Pacific (IDA & IBRD countries)EcuadorEgypt, Arab Rep.El SalvadorEstoniaEthiopiaEuro areaEurope & Central AsiaEurope & Central Asia (excluding high income)Europe & Central Asia (IDA & IBRD countries)European UnionFijiFinlandFragile and conflict affected situationsFranceFrench PolynesiaGabonGambia, TheGeorgiaGermanyGhanaGreeceGreenlandGrenadaGuatemalaGuineaGuinea-BissauGuyanaHaitiHeavily indebted poor countries (HIPC)High incomeHondurasHong Kong SAR, ChinaHungaryIBRD onlyIcelandIDA & IBRD totalIDA blendIDA onlyIDA totalIndiaIndonesiaIran, Islamic Rep.IraqIrelandItalyJamaicaJapanJordanKazakhstanKenyaKorea, Dem. People’s Rep.Korea, Rep.KuwaitKyrgyz RepublicLao PDRLate-demographic dividendLatin America & Caribbean Latin America & Caribbean (excluding high income)Latin America & the Caribbean (IDA & IBRD countries)LatviaLeast developed countries: UN classificationLebanonLiberiaLibyaLithuaniaLow & middle incomeLow incomeLower middle incomeLuxembourgMacao SAR, ChinaMacedonia, FYRMadagascarMalawiMalaysiaMaldivesMaliMaltaMauritaniaMauritiusMexicoMiddle East & North AfricaMiddle East & North Africa (excluding high income)Middle East & North Africa (IDA & IBRD countries)Middle incomeMoldovaMongoliaMontenegroMoroccoMozambiqueMyanmarNepalNetherlandsNew CaledoniaNew ZealandNicaraguaNigerNigeriaNorth AmericaNorwayOECD membersOmanOther small statesPacific island small statesPakistanPanamaPapua New GuineaParaguayPeruPhilippinesPolandPortugalPost-demographic dividendPre-demographic dividendQatarRomaniaRussian FederationRwandaSaudi ArabiaSenegalSerbiaSeychellesSierra LeoneSingaporeSlovak RepublicSloveniaSmall statesSomaliaSouth AfricaSouth AsiaSouth Asia (IDA & IBRD)SpainSri LankaSt. LuciaSt. Vincent and the GrenadinesSub-Saharan Africa Sub-Saharan Africa (excluding high income)Sub-Saharan Africa (IDA & IBRD countries)SudanSurinameSwedenSwitzerlandSyrian Arab RepublicTajikistanTanzaniaThailandTogoTrinidad and TobagoTunisiaTurkeyTurkmenistanUgandaUkraineUnited Arab EmiratesUnited KingdomUnited StatesUpper middle incomeUruguayVenezuela, RBVietnamWorldYemen, Rep.ZambiaZimbabwe Linea del tempo:
Questa scala temporale mostra un grafico dal 1961 anno al 2015 anno. Uganda. I dati fino ad 1960 anno non disponibili. Il numero di osservazioni attuali secondo i date: 55.
La fonte (nome):
Indicatori dello sviluppo mondiale
La fonte (organizzazione):
World Bank staff estimates based data from International Monetary Fund's Direction of Trade database.
Categorie:
Private Sector, Trade
sono stati aggiornati
23 apr 2017 anni
Indicatori delle variazioni dei valori per anni
Minima:
0.0
1 gen 1961 anni
Massimo:
21.746
1 gen 2015 anni
Alla data di osservazione
Valore
Variazione assoluta
La variazione rispetto al valore precedente
1 gen 1961 anni
0.0
0.0
0.0%
1 gen 1965 anni
0.109
+0.109
%
1 gen 1966 anni
0.0
-0.109
-100.0%
1 gen 1967 anni
0.083
+0.083
%
1 gen 1968 anni
0.0
-0.083
-100.0%
1 gen 1970 anni
0.078
+0.078
%
1 gen 1971 anni
0.078
+0.0
0.36%
1 gen 1972 anni
0.056
-0.022
-27.67%
1 gen 1973 anni
0.088
+0.032
56.63%
1 gen 1974 anni
0.389
+0.301
340.34%
1 gen 1975 anni
0.211
-0.178
-45.68%
1 gen 1976 anni
0.674
+0.463
219.26%
1 gen 1977 anni
0.661
-0.013
-1.92%
1 gen 1978 anni
0.285
-0.377
-56.94%
1 gen 1979 anni
0.602
+0.317
111.29%
1 gen 1980 anni
0.12
-0.482
-80.1%
1 gen 1981 anni
0.131
+0.011
9.31%
1 gen 1982 anni
1.045
+0.914
698.52%
1 gen 1983 anni
4.249
+3.203
306.46%
1 gen 1984 anni
2.967
-1.281
-30.16%
1 gen 1985 anni
3.51
+0.542
18.27%
1 gen 1986 anni
2.582
-0.928
-26.43%
1 gen 1987 anni
1.599
-0.983
-38.06%
1 gen 1988 anni
1.379
-0.221
-13.81%
1 gen 1989 anni
1.858
+0.479
34.77%
1 gen 1990 anni
2.59
+0.732
39.38%
1 gen 1991 anni
2.53
-0.06
-2.31%
1 gen 1992 anni
2.601
+0.071
2.81%
1 gen 1993 anni
3.721
+1.12
43.06%
1 gen 1994 anni
4.171
+0.451
12.11%
1 gen 1995 anni
2.959
-1.212
-29.06%
1 gen 1996 anni
2.91
-0.049
-1.67%
1 gen 1997 anni
2.422
-0.488
-16.76%
1 gen 1998 anni
2.29
-0.132
-5.44%
1 gen 1999 anni
2.468
+0.178
7.77%
1 gen 2000 anni
2.519
+0.05
2.04%
1 gen 2001 anni
6.72
+4.201
166.8%
1 gen 2002 anni
7.047
+0.326
4.86%
1 gen 2003 anni
7.056
+0.01
0.14%
1 gen 2004 anni
7.452
+0.396
5.61%
1 gen 2005 anni
6.742
-0.71
-9.53%
1 gen 2006 anni
9.858
+3.115
46.21%
1 gen 2007 anni
19.266
+9.408
95.44%
1 gen 2008 anni
16.447
-2.819
-14.63%
1 gen 2009 anni
16.835
+0.388
2.36%
1 gen 2010 anni
17.444
+0.609
3.62%
1 gen 2011 anni
19.798
+2.354
13.49%
1 gen 2012 anni
19.931
+0.133
0.67%
1 gen 2013 anni
20.968
+1.037
5.2%
1 gen 2014 anni
21.278
+0.31
1.48%
1 gen 2015 anni
21.746
+0.468
2.2%
Classificazione dei paesi secondo i statistiche attuali per anni


Commenti: