29
/it/
it
AIzaSyAYiBZKx7MnpbEhh9jyipgxe19OcubqV5w
April 1, 2024
101342
Canada
CAN
true
2
1
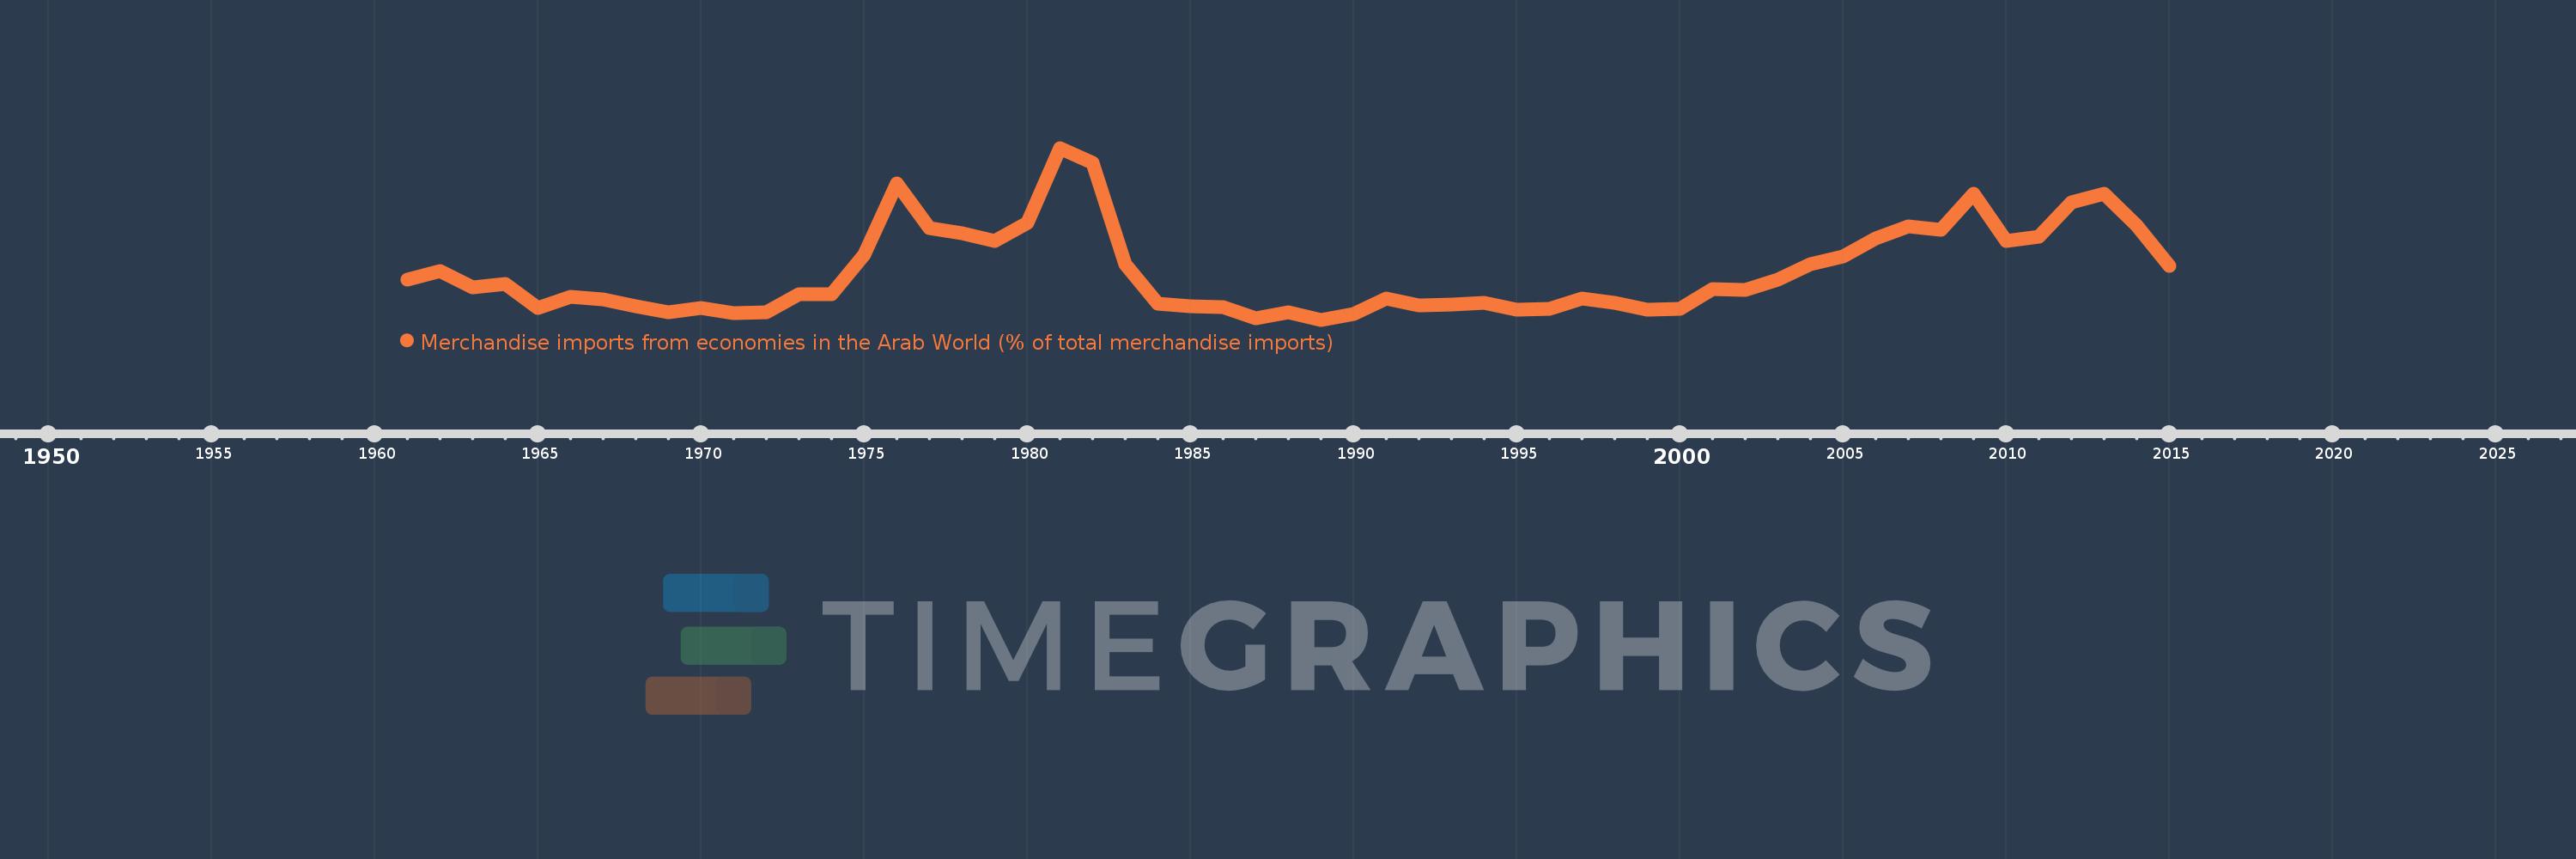
Merchandise imports from economies in the Arab World (% of total merchandise imports)
2015,2014,2013,2012,2011,2010,2009,2008,2007,2006,2005,2004,2003,2002,2001,2000,1999,1998,1997,1996,1995,1994,1993,1992,1991,1990,1989,1988,1987,1986,1985,1984,1983,1982,1981,1980,1979,1978,1977,1976,1975,1974,1973,1972,1971,1970,1969,1968,1967,1966,1965,1964,1963,1962,1961
Queste statistiche in altri paesi:
AfghanistanAlbaniaAlgeriaAngolaArab WorldArgentinaArmeniaArubaAustraliaAustriaAzerbaijanBahamas, TheBahrainBangladeshBarbadosBelarusBelgiumBelizeBeninBermudaBoliviaBrazilBrunei DarussalamBulgariaBurkina FasoBurundiCabo VerdeCambodiaCameroonCanadaCaribbean small statesCentral African RepublicCentral Europe and the BalticsChadChileChinaColombiaComorosCongo, Dem. Rep.Congo, Rep.Costa RicaCote d'IvoireCroatiaCubaCyprusCzech RepublicDenmarkDjiboutiDominicaDominican RepublicEarly-demographic dividendEast Asia & PacificEast Asia & Pacific (excluding high income)East Asia & Pacific (IDA & IBRD countries)EcuadorEgypt, Arab Rep.El SalvadorEstoniaEthiopiaEuro areaEurope & Central AsiaEurope & Central Asia (excluding high income)Europe & Central Asia (IDA & IBRD countries)European UnionFijiFinlandFragile and conflict affected situationsFranceFrench PolynesiaGabonGambia, TheGeorgiaGermanyGhanaGreeceGreenlandGrenadaGuatemalaGuineaGuinea-BissauGuyanaHaitiHeavily indebted poor countries (HIPC)High incomeHondurasHong Kong SAR, ChinaHungaryIBRD onlyIcelandIDA & IBRD totalIDA blendIDA onlyIDA totalIndiaIndonesiaIran, Islamic Rep.IraqIrelandItalyJamaicaJapanJordanKazakhstanKenyaKorea, Dem. People’s Rep.Korea, Rep.KuwaitKyrgyz RepublicLao PDRLate-demographic dividendLatin America & Caribbean Latin America & Caribbean (excluding high income)Latin America & the Caribbean (IDA & IBRD countries)LatviaLeast developed countries: UN classificationLebanonLiberiaLibyaLithuaniaLow & middle incomeLow incomeLower middle incomeLuxembourgMacao SAR, ChinaMacedonia, FYRMadagascarMalawiMalaysiaMaldivesMaliMaltaMauritaniaMauritiusMexicoMiddle East & North AfricaMiddle East & North Africa (excluding high income)Middle East & North Africa (IDA & IBRD countries)Middle incomeMoldovaMongoliaMontenegroMoroccoMozambiqueMyanmarNepalNetherlandsNew CaledoniaNew ZealandNicaraguaNigerNigeriaNorth AmericaNorwayOECD membersOmanOther small statesPacific island small statesPakistanPanamaPapua New GuineaParaguayPeruPhilippinesPolandPortugalPost-demographic dividendPre-demographic dividendQatarRomaniaRussian FederationRwandaSaudi ArabiaSenegalSerbiaSeychellesSierra LeoneSingaporeSlovak RepublicSloveniaSmall statesSomaliaSouth AfricaSouth AsiaSouth Asia (IDA & IBRD)SpainSri LankaSt. LuciaSt. Vincent and the GrenadinesSub-Saharan Africa Sub-Saharan Africa (excluding high income)Sub-Saharan Africa (IDA & IBRD countries)SudanSurinameSwedenSwitzerlandSyrian Arab RepublicTajikistanTanzaniaThailandTogoTrinidad and TobagoTunisiaTurkeyTurkmenistanUgandaUkraineUnited Arab EmiratesUnited KingdomUnited StatesUpper middle incomeUruguayVenezuela, RBVietnamWorldYemen, Rep.ZambiaZimbabwe Linea del tempo:
Questa scala temporale mostra un grafico dal 1961 anno al 2015 anno. Canada. I dati fino ad 1960 anno non disponibili. Il numero di osservazioni attuali secondo i date: 55.
La fonte (nome):
Indicatori dello sviluppo mondiale
La fonte (organizzazione):
World Bank staff estimates based data from International Monetary Fund's Direction of Trade database.
Categorie:
Private Sector, Trade
sono stati aggiornati
23 apr 2017 anni
Indicatori delle variazioni dei valori per anni
Minima:
0.198
1 gen 1989 anni
Massimo:
4.118
1 gen 1981 anni
Alla data di osservazione
Valore
Variazione assoluta
La variazione rispetto al valore precedente
1 gen 1961 anni
1.109
+1.109
0.0%
1 gen 1962 anni
1.307
+0.198
17.88%
1 gen 1963 anni
0.94
-0.366
-28.03%
1 gen 1964 anni
1.01
+0.07
7.45%
1 gen 1965 anni
0.475
-0.535
-52.98%
1 gen 1966 anni
0.723
+0.248
52.18%
1 gen 1967 anni
0.657
-0.066
-9.1%
1 gen 1968 anni
0.513
-0.144
-21.92%
1 gen 1969 anni
0.373
-0.141
-27.4%
1 gen 1970 anni
0.469
+0.097
25.91%
1 gen 1971 anni
0.351
-0.118
-25.17%
1 gen 1972 anni
0.36
+0.009
2.44%
1 gen 1973 anni
0.778
+0.419
116.41%
1 gen 1974 anni
0.781
+0.003
0.34%
1 gen 1975 anni
1.677
+0.896
114.69%
1 gen 1976 anni
3.305
+1.628
97.12%
1 gen 1977 anni
2.287
-1.017
-30.78%
1 gen 1978 anni
2.162
-0.126
-5.5%
1 gen 1979 anni
1.992
-0.169
-7.84%
1 gen 1980 anni
2.416
+0.424
21.29%
1 gen 1981 anni
4.118
+1.701
70.41%
1 gen 1982 anni
3.778
-0.34
-8.25%
1 gen 1983 anni
1.466
-2.311
-61.19%
1 gen 1984 anni
0.558
-0.908
-61.95%
1 gen 1985 anni
0.506
-0.052
-9.38%
1 gen 1986 anni
0.494
-0.012
-2.32%
1 gen 1987 anni
0.232
-0.262
-53.11%
1 gen 1988 anni
0.373
+0.141
60.96%
1 gen 1989 anni
0.198
-0.175
-46.97%
1 gen 1990 anni
0.321
+0.123
62.46%
1 gen 1991 anni
0.68
+0.359
111.88%
1 gen 1992 anni
0.535
-0.146
-21.41%
1 gen 1993 anni
0.537
+0.002
0.46%
1 gen 1994 anni
0.577
+0.04
7.39%
1 gen 1995 anni
0.432
-0.145
-25.08%
1 gen 1996 anni
0.44
+0.007
1.71%
1 gen 1997 anni
0.674
+0.234
53.32%
1 gen 1998 anni
0.586
-0.088
-13.01%
1 gen 1999 anni
0.418
-0.168
-28.65%
1 gen 2000 anni
0.454
+0.035
8.46%
1 gen 2001 anni
0.904
+0.45
99.27%
1 gen 2002 anni
0.885
-0.019
-2.12%
1 gen 2003 anni
1.108
+0.223
25.17%
1 gen 2004 anni
1.461
+0.353
31.91%
1 gen 2005 anni
1.648
+0.187
12.81%
1 gen 2006 anni
2.058
+0.41
24.87%
1 gen 2007 anni
2.326
+0.268
13.02%
1 gen 2008 anni
2.245
-0.081
-3.48%
1 gen 2009 anni
3.068
+0.823
36.64%
1 gen 2010 anni
2.001
-1.067
-34.79%
1 gen 2011 anni
2.101
+0.1
4.98%
1 gen 2012 anni
2.884
+0.784
37.31%
1 gen 2013 anni
3.064
+0.18
6.23%
1 gen 2014 anni
2.35
-0.714
-23.32%
1 gen 2015 anni
1.431
-0.919
-39.1%
Classificazione dei paesi secondo i statistiche attuali per anni


Commenti: