29
/it/
it
AIzaSyAYiBZKx7MnpbEhh9jyipgxe19OcubqV5w
April 1, 2024
164016
Japan
JPN
true
2
1
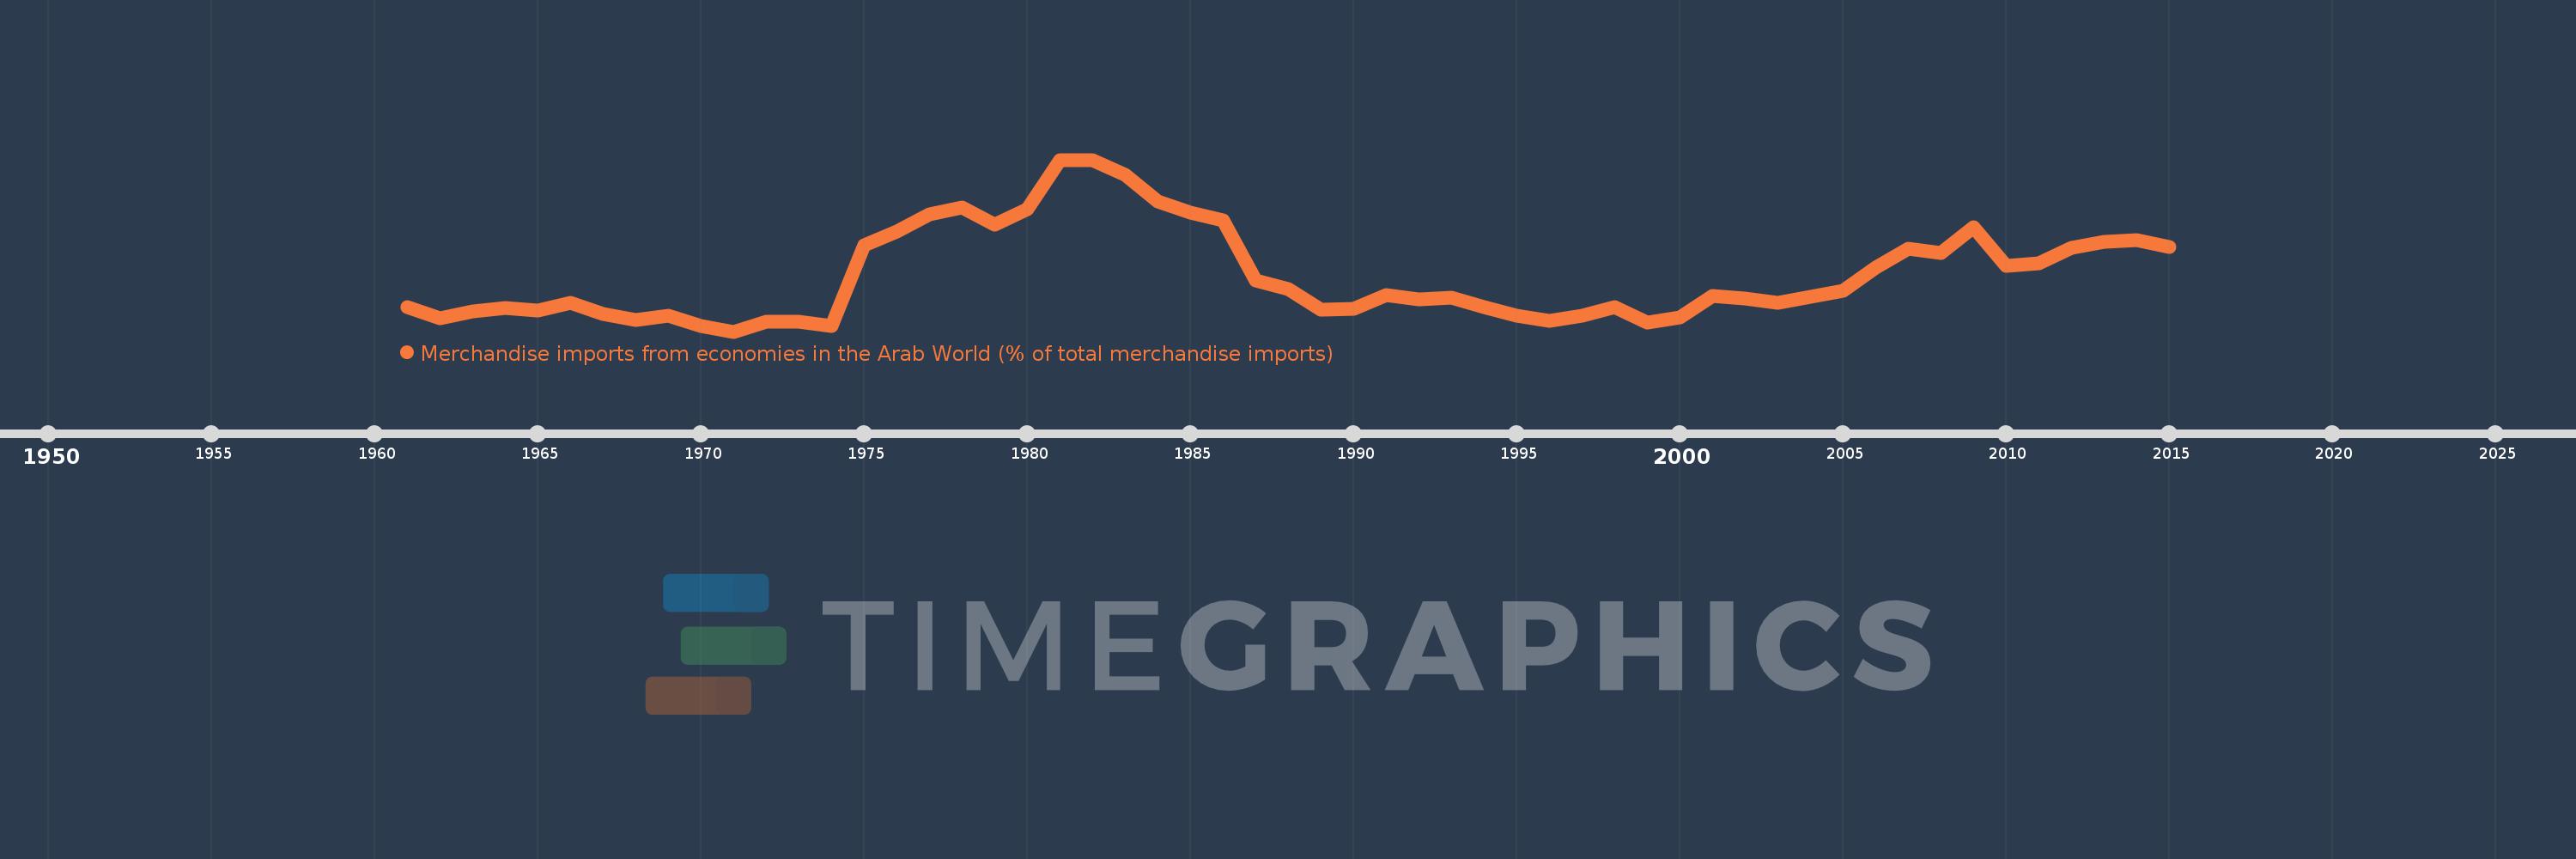
Merchandise imports from economies in the Arab World (% of total merchandise imports)
2015,2014,2013,2012,2011,2010,2009,2008,2007,2006,2005,2004,2003,2002,2001,2000,1999,1998,1997,1996,1995,1994,1993,1992,1991,1990,1989,1988,1987,1986,1985,1984,1983,1982,1981,1980,1979,1978,1977,1976,1975,1974,1973,1972,1971,1970,1969,1968,1967,1966,1965,1964,1963,1962,1961
Queste statistiche in altri paesi:
AfghanistanAlbaniaAlgeriaAngolaArab WorldArgentinaArmeniaArubaAustraliaAustriaAzerbaijanBahamas, TheBahrainBangladeshBarbadosBelarusBelgiumBelizeBeninBermudaBoliviaBrazilBrunei DarussalamBulgariaBurkina FasoBurundiCabo VerdeCambodiaCameroonCanadaCaribbean small statesCentral African RepublicCentral Europe and the BalticsChadChileChinaColombiaComorosCongo, Dem. Rep.Congo, Rep.Costa RicaCote d'IvoireCroatiaCubaCyprusCzech RepublicDenmarkDjiboutiDominicaDominican RepublicEarly-demographic dividendEast Asia & PacificEast Asia & Pacific (excluding high income)East Asia & Pacific (IDA & IBRD countries)EcuadorEgypt, Arab Rep.El SalvadorEstoniaEthiopiaEuro areaEurope & Central AsiaEurope & Central Asia (excluding high income)Europe & Central Asia (IDA & IBRD countries)European UnionFijiFinlandFragile and conflict affected situationsFranceFrench PolynesiaGabonGambia, TheGeorgiaGermanyGhanaGreeceGreenlandGrenadaGuatemalaGuineaGuinea-BissauGuyanaHaitiHeavily indebted poor countries (HIPC)High incomeHondurasHong Kong SAR, ChinaHungaryIBRD onlyIcelandIDA & IBRD totalIDA blendIDA onlyIDA totalIndiaIndonesiaIran, Islamic Rep.IraqIrelandItalyJamaicaJapanJordanKazakhstanKenyaKorea, Dem. People’s Rep.Korea, Rep.KuwaitKyrgyz RepublicLao PDRLate-demographic dividendLatin America & Caribbean Latin America & Caribbean (excluding high income)Latin America & the Caribbean (IDA & IBRD countries)LatviaLeast developed countries: UN classificationLebanonLiberiaLibyaLithuaniaLow & middle incomeLow incomeLower middle incomeLuxembourgMacao SAR, ChinaMacedonia, FYRMadagascarMalawiMalaysiaMaldivesMaliMaltaMauritaniaMauritiusMexicoMiddle East & North AfricaMiddle East & North Africa (excluding high income)Middle East & North Africa (IDA & IBRD countries)Middle incomeMoldovaMongoliaMontenegroMoroccoMozambiqueMyanmarNepalNetherlandsNew CaledoniaNew ZealandNicaraguaNigerNigeriaNorth AmericaNorwayOECD membersOmanOther small statesPacific island small statesPakistanPanamaPapua New GuineaParaguayPeruPhilippinesPolandPortugalPost-demographic dividendPre-demographic dividendQatarRomaniaRussian FederationRwandaSaudi ArabiaSenegalSerbiaSeychellesSierra LeoneSingaporeSlovak RepublicSloveniaSmall statesSomaliaSouth AfricaSouth AsiaSouth Asia (IDA & IBRD)SpainSri LankaSt. LuciaSt. Vincent and the GrenadinesSub-Saharan Africa Sub-Saharan Africa (excluding high income)Sub-Saharan Africa (IDA & IBRD countries)SudanSurinameSwedenSwitzerlandSyrian Arab RepublicTajikistanTanzaniaThailandTogoTrinidad and TobagoTunisiaTurkeyTurkmenistanUgandaUkraineUnited Arab EmiratesUnited KingdomUnited StatesUpper middle incomeUruguayVenezuela, RBVietnamWorldYemen, Rep.ZambiaZimbabwe Linea del tempo:
Questa scala temporale mostra un grafico dal 1961 anno al 2015 anno. Japan. I dati fino ad 1960 anno non disponibili. Il numero di osservazioni attuali secondo i date: 55.
La fonte (nome):
Indicatori dello sviluppo mondiale
La fonte (organizzazione):
World Bank staff estimates based data from International Monetary Fund's Direction of Trade database.
Categorie:
Private Sector, Trade
sono stati aggiornati
23 apr 2017 anni
Indicatori delle variazioni dei valori per anni
Minima:
7.006
1 gen 1971 anni
Massimo:
28.929
1 gen 1981 anni
Alla data di osservazione
Valore
Variazione assoluta
La variazione rispetto al valore precedente
1 gen 1961 anni
10.12
+10.12
0.0%
1 gen 1962 anni
8.651
-1.469
-14.51%
1 gen 1963 anni
9.602
+0.951
10.99%
1 gen 1964 anni
10.031
+0.429
4.47%
1 gen 1965 anni
9.688
-0.343
-3.42%
1 gen 1966 anni
10.722
+1.034
10.67%
1 gen 1967 anni
9.264
-1.458
-13.6%
1 gen 1968 anni
8.493
-0.771
-8.33%
1 gen 1969 anni
9.045
+0.552
6.5%
1 gen 1970 anni
7.714
-1.331
-14.71%
1 gen 1971 anni
7.006
-0.708
-9.18%
1 gen 1972 anni
8.243
+1.237
17.66%
1 gen 1973 anni
8.316
+0.073
0.88%
1 gen 1974 anni
7.727
-0.588
-7.08%
1 gen 1975 anni
18.004
+10.276
132.99%
1 gen 1976 anni
19.826
+1.822
10.12%
1 gen 1977 anni
21.986
+2.161
10.9%
1 gen 1978 anni
22.887
+0.901
4.1%
1 gen 1979 anni
20.68
-2.207
-9.64%
1 gen 1980 anni
22.572
+1.892
9.15%
1 gen 1981 anni
28.929
+6.357
28.16%
1 gen 1982 anni
28.854
-0.074
-0.26%
1 gen 1983 anni
27.025
-1.829
-6.34%
1 gen 1984 anni
23.599
-3.425
-12.68%
1 gen 1985 anni
22.133
-1.466
-6.21%
1 gen 1986 anni
21.191
-0.943
-4.26%
1 gen 1987 anni
13.558
-7.633
-36.02%
1 gen 1988 anni
12.414
-1.144
-8.44%
1 gen 1989 anni
9.76
-2.654
-21.38%
1 gen 1990 anni
9.93
+0.17
1.74%
1 gen 1991 anni
11.686
+1.756
17.68%
1 gen 1992 anni
11.125
-0.561
-4.8%
1 gen 1993 anni
11.356
+0.231
2.08%
1 gen 1994 anni
10.175
-1.181
-10.4%
1 gen 1995 anni
9.001
-1.173
-11.53%
1 gen 1996 anni
8.399
-0.602
-6.69%
1 gen 1997 anni
9.012
+0.612
7.29%
1 gen 1998 anni
10.149
+1.137
12.61%
1 gen 1999 anni
8.137
-2.011
-19.82%
1 gen 2000 anni
8.796
+0.659
8.1%
1 gen 2001 anni
11.559
+2.763
31.41%
1 gen 2002 anni
11.253
-0.306
-2.65%
1 gen 2003 anni
10.69
-0.563
-5.0%
1 gen 2004 anni
11.473
+0.782
7.32%
1 gen 2005 anni
12.2
+0.728
6.34%
1 gen 2006 anni
15.213
+3.013
24.7%
1 gen 2007 anni
17.615
+2.401
15.78%
1 gen 2008 anni
17.01
-0.605
-3.43%
1 gen 2009 anni
20.323
+3.313
19.48%
1 gen 2010 anni
15.357
-4.965
-24.43%
1 gen 2011 anni
15.713
+0.355
2.31%
1 gen 2012 anni
17.647
+1.934
12.31%
1 gen 2013 anni
18.443
+0.796
4.51%
1 gen 2014 anni
18.65
+0.206
1.12%
1 gen 2015 anni
17.818
-0.832
-4.46%
Classificazione dei paesi secondo i statistiche attuali per anni


Commenti: