29
/it/
it
AIzaSyAYiBZKx7MnpbEhh9jyipgxe19OcubqV5w
April 1, 2024
195850
Mexico
MEX
true
2
1
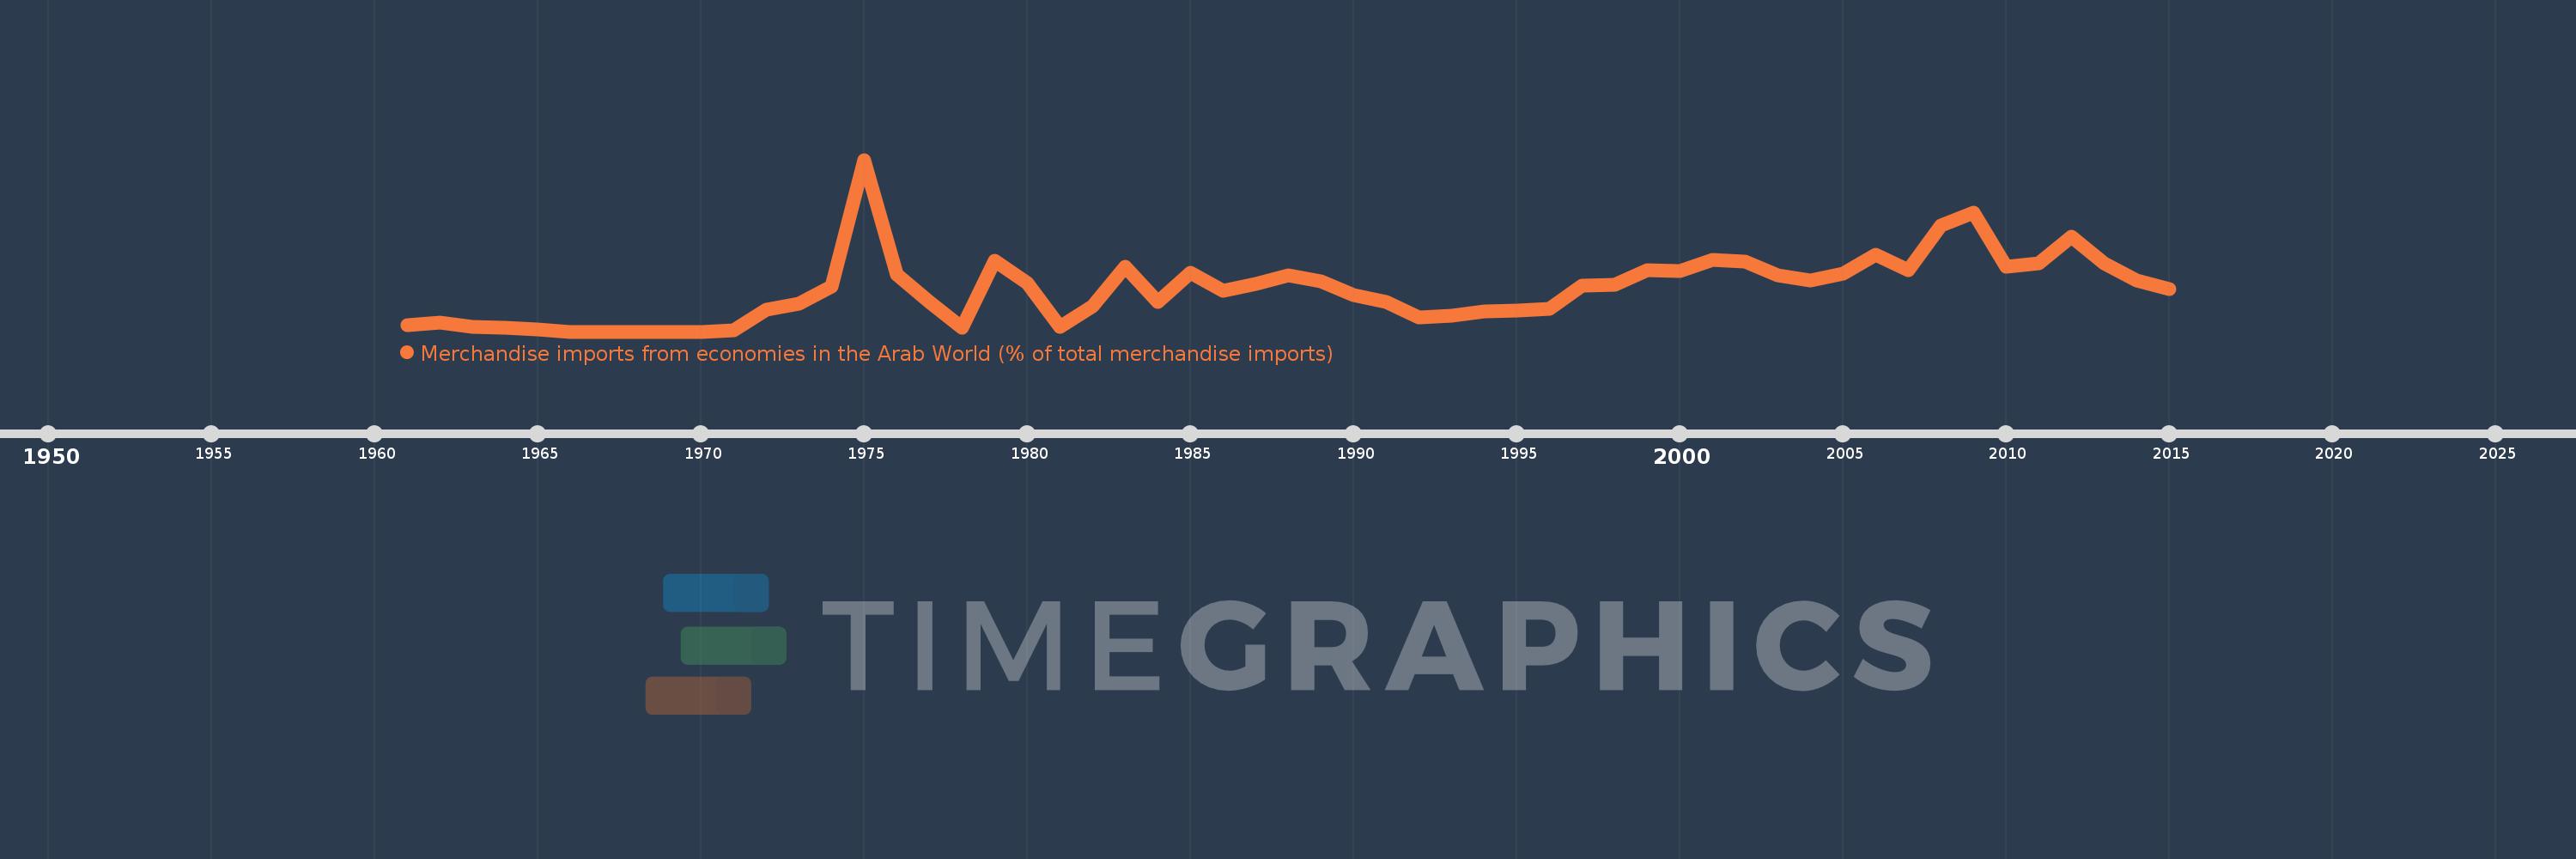
Merchandise imports from economies in the Arab World (% of total merchandise imports)
2015,2014,2013,2012,2011,2010,2009,2008,2007,2006,2005,2004,2003,2002,2001,2000,1999,1998,1997,1996,1995,1994,1993,1992,1991,1990,1989,1988,1987,1986,1985,1984,1983,1982,1981,1980,1979,1978,1977,1976,1975,1974,1973,1972,1971,1970,1969,1968,1967,1966,1965,1964,1963,1962,1961
Queste statistiche in altri paesi:
AfghanistanAlbaniaAlgeriaAngolaArab WorldArgentinaArmeniaArubaAustraliaAustriaAzerbaijanBahamas, TheBahrainBangladeshBarbadosBelarusBelgiumBelizeBeninBermudaBoliviaBrazilBrunei DarussalamBulgariaBurkina FasoBurundiCabo VerdeCambodiaCameroonCanadaCaribbean small statesCentral African RepublicCentral Europe and the BalticsChadChileChinaColombiaComorosCongo, Dem. Rep.Congo, Rep.Costa RicaCote d'IvoireCroatiaCubaCyprusCzech RepublicDenmarkDjiboutiDominicaDominican RepublicEarly-demographic dividendEast Asia & PacificEast Asia & Pacific (excluding high income)East Asia & Pacific (IDA & IBRD countries)EcuadorEgypt, Arab Rep.El SalvadorEstoniaEthiopiaEuro areaEurope & Central AsiaEurope & Central Asia (excluding high income)Europe & Central Asia (IDA & IBRD countries)European UnionFijiFinlandFragile and conflict affected situationsFranceFrench PolynesiaGabonGambia, TheGeorgiaGermanyGhanaGreeceGreenlandGrenadaGuatemalaGuineaGuinea-BissauGuyanaHaitiHeavily indebted poor countries (HIPC)High incomeHondurasHong Kong SAR, ChinaHungaryIBRD onlyIcelandIDA & IBRD totalIDA blendIDA onlyIDA totalIndiaIndonesiaIran, Islamic Rep.IraqIrelandItalyJamaicaJapanJordanKazakhstanKenyaKorea, Dem. People’s Rep.Korea, Rep.KuwaitKyrgyz RepublicLao PDRLate-demographic dividendLatin America & Caribbean Latin America & Caribbean (excluding high income)Latin America & the Caribbean (IDA & IBRD countries)LatviaLeast developed countries: UN classificationLebanonLiberiaLibyaLithuaniaLow & middle incomeLow incomeLower middle incomeLuxembourgMacao SAR, ChinaMacedonia, FYRMadagascarMalawiMalaysiaMaldivesMaliMaltaMauritaniaMauritiusMexicoMiddle East & North AfricaMiddle East & North Africa (excluding high income)Middle East & North Africa (IDA & IBRD countries)Middle incomeMoldovaMongoliaMontenegroMoroccoMozambiqueMyanmarNepalNetherlandsNew CaledoniaNew ZealandNicaraguaNigerNigeriaNorth AmericaNorwayOECD membersOmanOther small statesPacific island small statesPakistanPanamaPapua New GuineaParaguayPeruPhilippinesPolandPortugalPost-demographic dividendPre-demographic dividendQatarRomaniaRussian FederationRwandaSaudi ArabiaSenegalSerbiaSeychellesSierra LeoneSingaporeSlovak RepublicSloveniaSmall statesSomaliaSouth AfricaSouth AsiaSouth Asia (IDA & IBRD)SpainSri LankaSt. LuciaSt. Vincent and the GrenadinesSub-Saharan Africa Sub-Saharan Africa (excluding high income)Sub-Saharan Africa (IDA & IBRD countries)SudanSurinameSwedenSwitzerlandSyrian Arab RepublicTajikistanTanzaniaThailandTogoTrinidad and TobagoTunisiaTurkeyTurkmenistanUgandaUkraineUnited Arab EmiratesUnited KingdomUnited StatesUpper middle incomeUruguayVenezuela, RBVietnamWorldYemen, Rep.ZambiaZimbabwe Linea del tempo:
Questa scala temporale mostra un grafico dal 1961 anno al 2015 anno. Mexico. I dati fino ad 1960 anno non disponibili. Il numero di osservazioni attuali secondo i date: 55.
La fonte (nome):
Indicatori dello sviluppo mondiale
La fonte (organizzazione):
World Bank staff estimates based data from International Monetary Fund's Direction of Trade database.
Categorie:
Private Sector, Trade
sono stati aggiornati
23 apr 2017 anni
Indicatori delle variazioni dei valori per anni
Minima:
0.0
1 gen 1966 anni
Massimo:
0.667
1 gen 1975 anni
Alla data di osservazione
Valore
Variazione assoluta
La variazione rispetto al valore precedente
1 gen 1961 anni
0.025
+0.025
0.0%
1 gen 1962 anni
0.035
+0.01
38.84%
1 gen 1963 anni
0.018
-0.018
-50.12%
1 gen 1964 anni
0.016
-0.001
-7.75%
1 gen 1965 anni
0.007
-0.009
-58.47%
1 gen 1966 anni
0.0
-0.007
-100.0%
1 gen 1971 anni
0.004
+0.004
%
1 gen 1972 anni
0.084
+0.08
1.87 Mille.%
1 gen 1973 anni
0.11
+0.026
30.76%
1 gen 1974 anni
0.176
+0.065
59.34%
1 gen 1975 anni
0.667
+0.491
279.45%
1 gen 1976 anni
0.222
-0.445
-66.74%
1 gen 1977 anni
0.116
-0.106
-47.72%
1 gen 1978 anni
0.016
-0.1
-85.85%
1 gen 1979 anni
0.276
+0.26
1.59 Mille.%
1 gen 1980 anni
0.189
-0.087
-31.46%
1 gen 1981 anni
0.02
-0.169
-89.42%
1 gen 1982 anni
0.099
+0.079
392.09%
1 gen 1983 anni
0.253
+0.154
156.27%
1 gen 1984 anni
0.115
-0.137
-54.39%
1 gen 1985 anni
0.229
+0.114
98.5%
1 gen 1986 anni
0.157
-0.072
-31.45%
1 gen 1987 anni
0.186
+0.029
18.28%
1 gen 1988 anni
0.218
+0.032
17.42%
1 gen 1989 anni
0.195
-0.023
-10.37%
1 gen 1990 anni
0.143
-0.053
-26.93%
1 gen 1991 anni
0.114
-0.028
-19.92%
1 gen 1992 anni
0.056
-0.058
-50.64%
1 gen 1993 anni
0.061
+0.004
7.93%
1 gen 1994 anni
0.077
+0.016
25.91%
1 gen 1995 anni
0.081
+0.005
5.93%
1 gen 1996 anni
0.088
+0.007
8.82%
1 gen 1997 anni
0.178
+0.09
101.63%
1 gen 1998 anni
0.183
+0.005
2.99%
1 gen 1999 anni
0.238
+0.055
29.97%
1 gen 2000 anni
0.236
-0.002
-0.91%
1 gen 2001 anni
0.278
+0.042
17.73%
1 gen 2002 anni
0.271
-0.007
-2.47%
1 gen 2003 anni
0.22
-0.051
-18.72%
1 gen 2004 anni
0.2
-0.021
-9.37%
1 gen 2005 anni
0.225
+0.025
12.35%
1 gen 2006 anni
0.298
+0.074
32.87%
1 gen 2007 anni
0.238
-0.06
-20.09%
1 gen 2008 anni
0.411
+0.173
72.49%
1 gen 2009 anni
0.463
+0.051
12.5%
1 gen 2010 anni
0.253
-0.209
-45.2%
1 gen 2011 anni
0.264
+0.01
4.08%
1 gen 2012 anni
0.37
+0.106
40.16%
1 gen 2013 anni
0.264
-0.106
-28.66%
1 gen 2014 anni
0.2
-0.064
-24.16%
1 gen 2015 anni
0.166
-0.034
-17.11%
Classificazione dei paesi secondo i statistiche attuali per anni


Commenti: