29
/it/
it
AIzaSyAYiBZKx7MnpbEhh9jyipgxe19OcubqV5w
April 1, 2024
105148
Chile
CHL
true
2
1
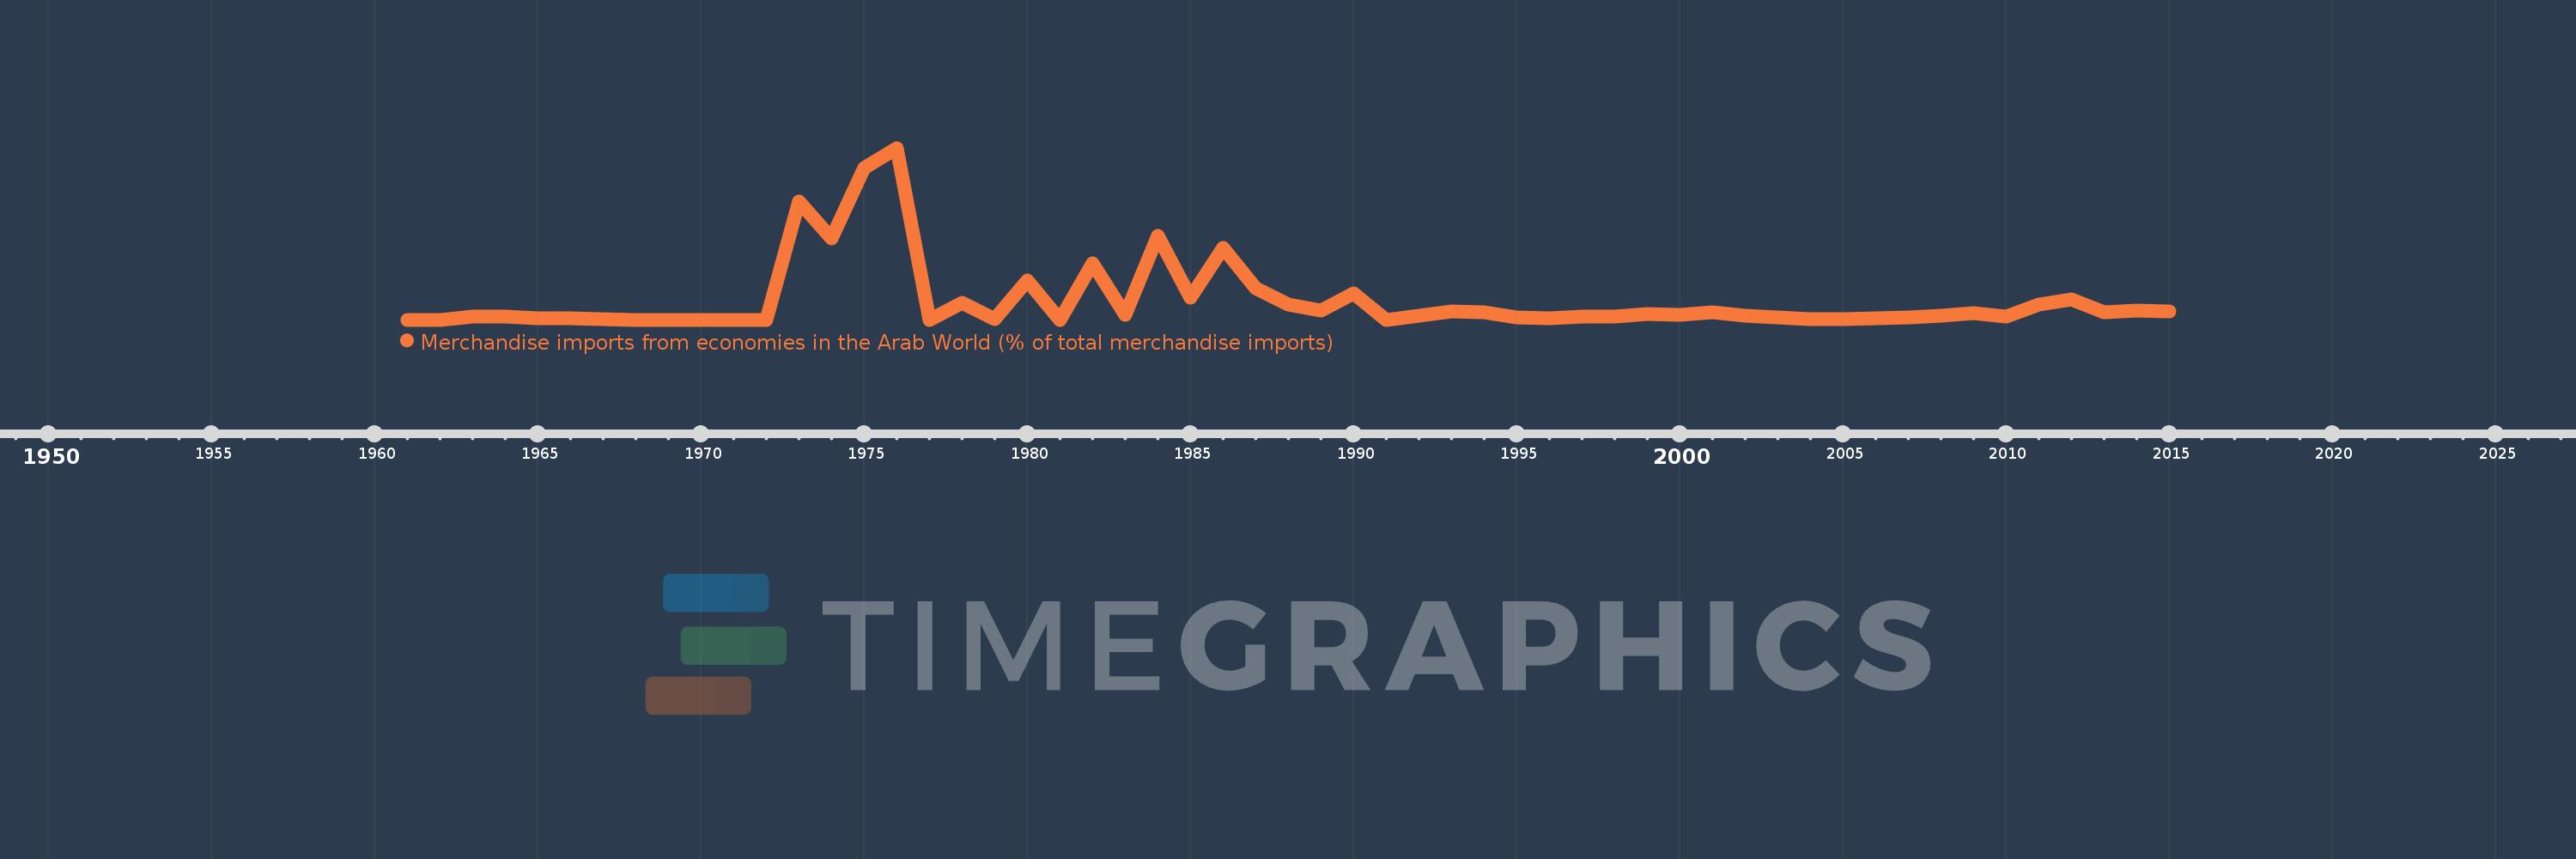
Merchandise imports from economies in the Arab World (% of total merchandise imports)
2015,2014,2013,2012,2011,2010,2009,2008,2007,2006,2005,2004,2003,2002,2001,2000,1999,1998,1997,1996,1995,1994,1993,1992,1991,1990,1989,1988,1987,1986,1985,1984,1983,1982,1981,1980,1979,1978,1977,1976,1975,1974,1973,1972,1971,1970,1969,1968,1967,1966,1965,1964,1963,1962,1961
Queste statistiche in altri paesi:
AfghanistanAlbaniaAlgeriaAngolaArab WorldArgentinaArmeniaArubaAustraliaAustriaAzerbaijanBahamas, TheBahrainBangladeshBarbadosBelarusBelgiumBelizeBeninBermudaBoliviaBrazilBrunei DarussalamBulgariaBurkina FasoBurundiCabo VerdeCambodiaCameroonCanadaCaribbean small statesCentral African RepublicCentral Europe and the BalticsChadChileChinaColombiaComorosCongo, Dem. Rep.Congo, Rep.Costa RicaCote d'IvoireCroatiaCubaCyprusCzech RepublicDenmarkDjiboutiDominicaDominican RepublicEarly-demographic dividendEast Asia & PacificEast Asia & Pacific (excluding high income)East Asia & Pacific (IDA & IBRD countries)EcuadorEgypt, Arab Rep.El SalvadorEstoniaEthiopiaEuro areaEurope & Central AsiaEurope & Central Asia (excluding high income)Europe & Central Asia (IDA & IBRD countries)European UnionFijiFinlandFragile and conflict affected situationsFranceFrench PolynesiaGabonGambia, TheGeorgiaGermanyGhanaGreeceGreenlandGrenadaGuatemalaGuineaGuinea-BissauGuyanaHaitiHeavily indebted poor countries (HIPC)High incomeHondurasHong Kong SAR, ChinaHungaryIBRD onlyIcelandIDA & IBRD totalIDA blendIDA onlyIDA totalIndiaIndonesiaIran, Islamic Rep.IraqIrelandItalyJamaicaJapanJordanKazakhstanKenyaKorea, Dem. People’s Rep.Korea, Rep.KuwaitKyrgyz RepublicLao PDRLate-demographic dividendLatin America & Caribbean Latin America & Caribbean (excluding high income)Latin America & the Caribbean (IDA & IBRD countries)LatviaLeast developed countries: UN classificationLebanonLiberiaLibyaLithuaniaLow & middle incomeLow incomeLower middle incomeLuxembourgMacao SAR, ChinaMacedonia, FYRMadagascarMalawiMalaysiaMaldivesMaliMaltaMauritaniaMauritiusMexicoMiddle East & North AfricaMiddle East & North Africa (excluding high income)Middle East & North Africa (IDA & IBRD countries)Middle incomeMoldovaMongoliaMontenegroMoroccoMozambiqueMyanmarNepalNetherlandsNew CaledoniaNew ZealandNicaraguaNigerNigeriaNorth AmericaNorwayOECD membersOmanOther small statesPacific island small statesPakistanPanamaPapua New GuineaParaguayPeruPhilippinesPolandPortugalPost-demographic dividendPre-demographic dividendQatarRomaniaRussian FederationRwandaSaudi ArabiaSenegalSerbiaSeychellesSierra LeoneSingaporeSlovak RepublicSloveniaSmall statesSomaliaSouth AfricaSouth AsiaSouth Asia (IDA & IBRD)SpainSri LankaSt. LuciaSt. Vincent and the GrenadinesSub-Saharan Africa Sub-Saharan Africa (excluding high income)Sub-Saharan Africa (IDA & IBRD countries)SudanSurinameSwedenSwitzerlandSyrian Arab RepublicTajikistanTanzaniaThailandTogoTrinidad and TobagoTunisiaTurkeyTurkmenistanUgandaUkraineUnited Arab EmiratesUnited KingdomUnited StatesUpper middle incomeUruguayVenezuela, RBVietnamWorldYemen, Rep.ZambiaZimbabwe Linea del tempo:
Questa scala temporale mostra un grafico dal 1961 anno al 2015 anno. Chile. I dati fino ad 1960 anno non disponibili. Il numero di osservazioni attuali secondo i date: 55.
La fonte (nome):
Indicatori dello sviluppo mondiale
La fonte (organizzazione):
World Bank staff estimates based data from International Monetary Fund's Direction of Trade database.
Categorie:
Private Sector, Trade
sono stati aggiornati
23 apr 2017 anni
Indicatori delle variazioni dei valori per anni
Minima:
0.0
1 gen 1961 anni
Massimo:
5.915
1 gen 1976 anni
Alla data di osservazione
Valore
Variazione assoluta
La variazione rispetto al valore precedente
1 gen 1961 anni
0.0
0.0
0.0%
1 gen 1963 anni
0.098
+0.098
%
1 gen 1964 anni
0.11
+0.012
12.36%
1 gen 1965 anni
0.049
-0.061
-55.13%
1 gen 1966 anni
0.05
+0.0
0.83%
1 gen 1967 anni
0.012
-0.038
-76.13%
1 gen 1968 anni
0.0
-0.012
-100.0%
1 gen 1973 anni
4.058
+4.058
%
1 gen 1974 anni
2.81
-1.248
-30.76%
1 gen 1975 anni
5.23
+2.42
86.12%
1 gen 1976 anni
5.915
+0.686
13.11%
1 gen 1977 anni
0.0
-5.915
-100.0%
1 gen 1978 anni
0.575
+0.575
%
1 gen 1979 anni
0.017
-0.559
-97.1%
1 gen 1980 anni
1.337
+1.321
7.93 Mille.%
1 gen 1981 anni
0.0
-1.337
-100.0%
1 gen 1982 anni
1.956
+1.956
%
1 gen 1983 anni
0.173
-1.783
-91.18%
1 gen 1984 anni
2.885
+2.712
1.57 Mille.%
1 gen 1985 anni
0.747
-2.138
-74.12%
1 gen 1986 anni
2.49
+1.744
233.52%
1 gen 1987 anni
1.086
-1.405
-56.4%
1 gen 1988 anni
0.512
-0.574
-52.83%
1 gen 1989 anni
0.325
-0.187
-36.54%
1 gen 1990 anni
0.901
+0.576
177.15%
1 gen 1991 anni
0.0
-0.901
-100.0%
1 gen 1992 anni
0.147
+0.147
%
1 gen 1993 anni
0.292
+0.145
98.61%
1 gen 1994 anni
0.263
-0.028
-9.71%
1 gen 1995 anni
0.072
-0.191
-72.69%
1 gen 1996 anni
0.057
-0.014
-20.01%
1 gen 1997 anni
0.123
+0.066
113.95%
1 gen 1998 anni
0.117
-0.007
-5.29%
1 gen 1999 anni
0.205
+0.089
76.13%
1 gen 2000 anni
0.171
-0.034
-16.8%
1 gen 2001 anni
0.268
+0.098
57.2%
1 gen 2002 anni
0.149
-0.119
-44.31%
1 gen 2003 anni
0.066
-0.084
-55.96%
1 gen 2004 anni
0.03
-0.036
-54.44%
1 gen 2005 anni
0.029
-0.001
-3.26%
1 gen 2006 anni
0.043
+0.014
49.23%
1 gen 2007 anni
0.071
+0.028
63.94%
1 gen 2008 anni
0.139
+0.068
95.6%
1 gen 2009 anni
0.23
+0.092
65.95%
1 gen 2010 anni
0.098
-0.132
-57.31%
1 gen 2011 anni
0.518
+0.419
426.26%
1 gen 2012 anni
0.704
+0.187
36.05%
1 gen 2013 anni
0.252
-0.453
-64.27%
1 gen 2014 anni
0.313
+0.062
24.48%
1 gen 2015 anni
0.287
-0.026
-8.24%
Classificazione dei paesi secondo i statistiche attuali per anni


Commenti: