29
/it/
it
AIzaSyAYiBZKx7MnpbEhh9jyipgxe19OcubqV5w
April 1, 2024
59822
Sub-Saharan Africa (excluding high income)
SSA
false
2
1
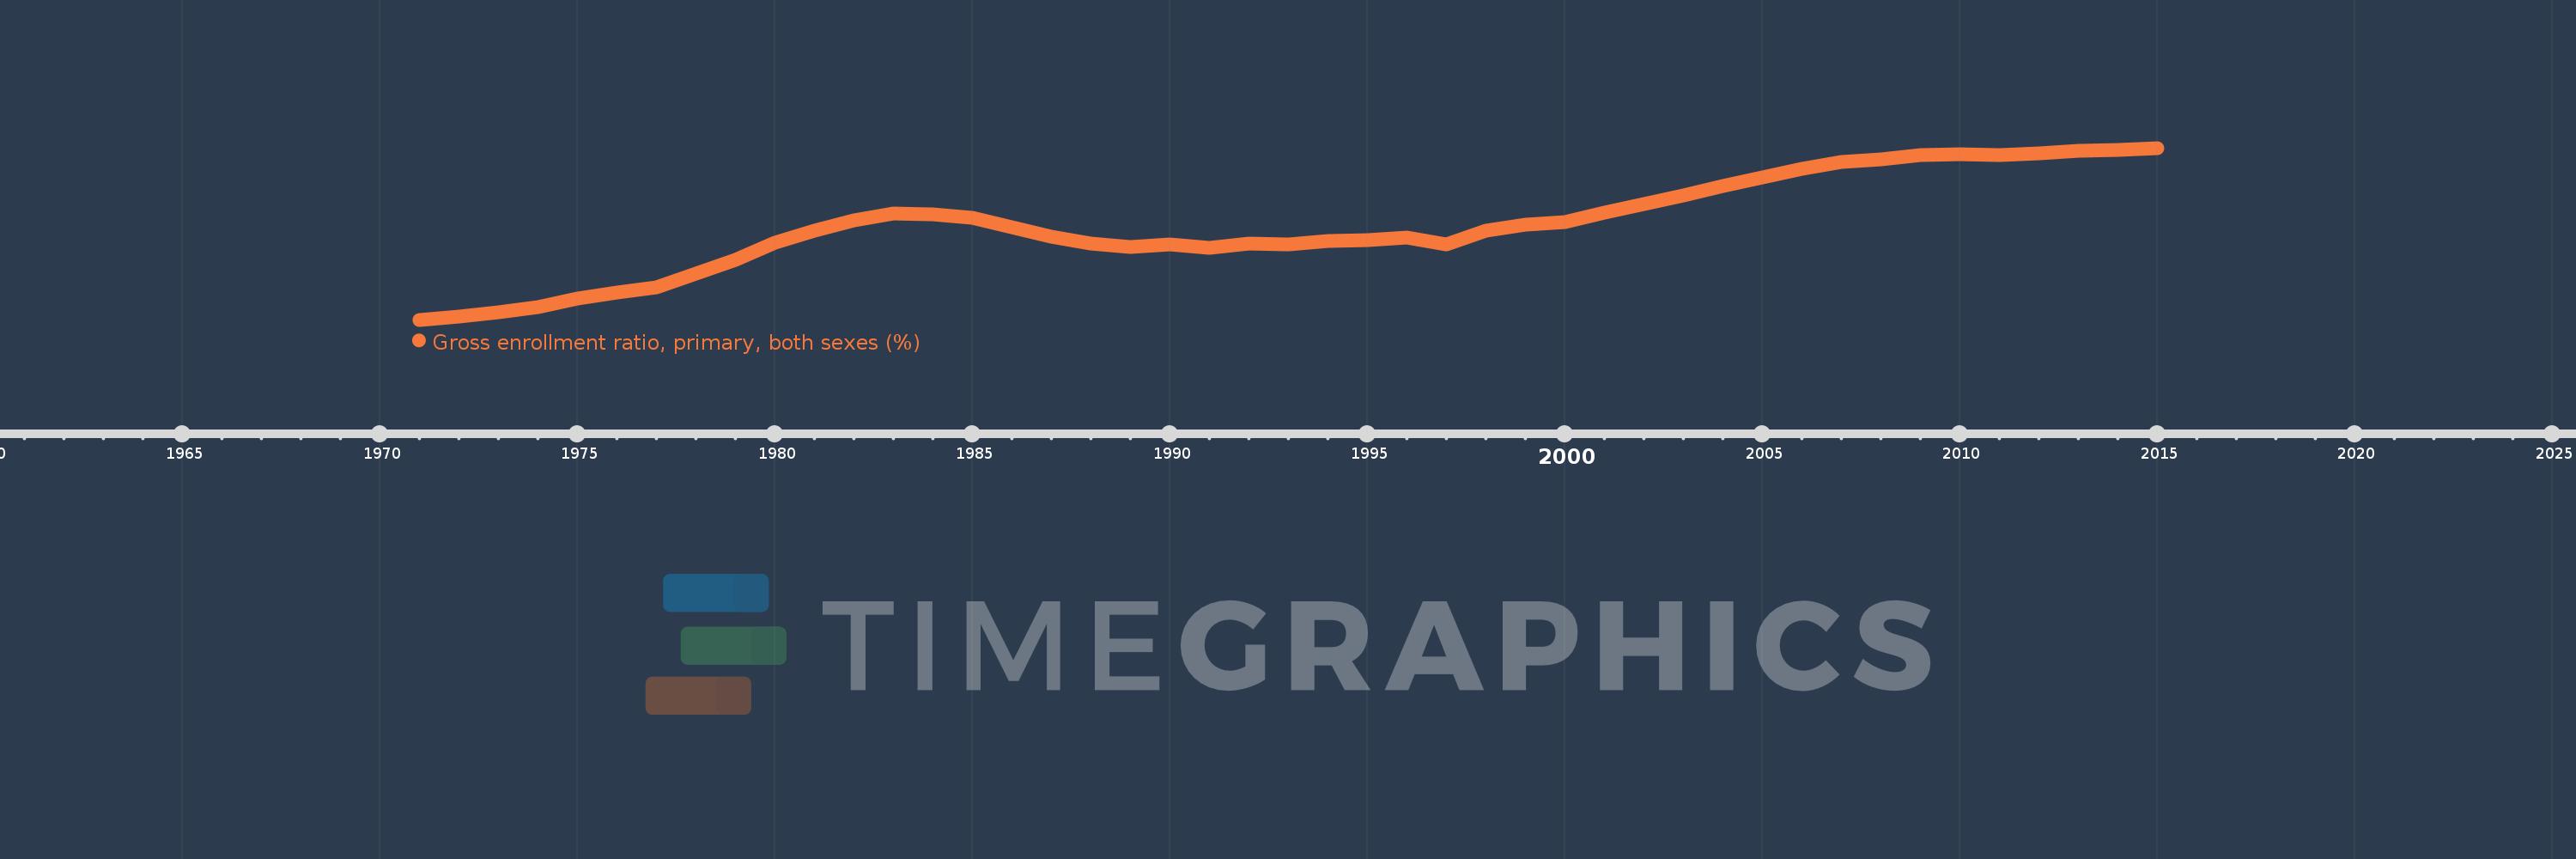
Gross enrollment ratio, primary, both sexes (%)
2015,2014,2013,2012,2011,2010,2009,2008,2007,2006,2005,2004,2003,2002,2001,2000,1999,1998,1997,1996,1995,1994,1993,1992,1991,1990,1989,1988,1987,1986,1985,1984,1983,1982,1981,1980,1979,1978,1977,1976,1975,1974,1973,1972,1971
Queste statistiche in altri paesi:
AfghanistanAlbaniaAlgeriaAndorraAngolaAntigua and BarbudaArab WorldArgentinaArmeniaArubaAustraliaAustriaAzerbaijanBahamas, TheBahrainBangladeshBarbadosBelarusBelgiumBelizeBeninBermudaBhutanBoliviaBosnia and HerzegovinaBotswanaBrazilBritish Virgin IslandsBrunei DarussalamBulgariaBurkina FasoBurundiCabo VerdeCambodiaCameroonCanadaCaribbean small statesCentral African RepublicCentral Europe and the BalticsChadChileChinaColombiaComorosCongo, Dem. Rep.Congo, Rep.Costa RicaCote d'IvoireCroatiaCubaCuracaoCyprusCzech RepublicDenmarkDjiboutiDominicaDominican RepublicEarly-demographic dividendEast Asia & PacificEast Asia & Pacific (excluding high income)East Asia & Pacific (IDA & IBRD countries)EcuadorEgypt, Arab Rep.El SalvadorEquatorial GuineaEritreaEstoniaEthiopiaEuro areaEurope & Central AsiaEurope & Central Asia (excluding high income)Europe & Central Asia (IDA & IBRD countries)European UnionFijiFinlandFragile and conflict affected situationsFranceGabonGambia, TheGeorgiaGermanyGhanaGreeceGrenadaGuatemalaGuineaGuinea-BissauGuyanaHaitiHeavily indebted poor countries (HIPC)High incomeHondurasHong Kong SAR, ChinaHungaryIBRD onlyIcelandIDA & IBRD totalIDA blendIDA onlyIDA totalIndiaIndonesiaIran, Islamic Rep.IraqIrelandIsraelItalyJamaicaJapanJordanKazakhstanKenyaKiribatiKorea, Dem. People’s Rep.Korea, Rep.KuwaitKyrgyz RepublicLao PDRLate-demographic dividendLatin America & Caribbean Latin America & Caribbean (excluding high income)Latin America & the Caribbean (IDA & IBRD countries)LatviaLeast developed countries: UN classificationLebanonLesothoLiberiaLibyaLiechtensteinLithuaniaLow & middle incomeLow incomeLower middle incomeLuxembourgMacao SAR, ChinaMacedonia, FYRMadagascarMalawiMalaysiaMaldivesMaliMaltaMarshall IslandsMauritaniaMauritiusMexicoMicronesia, Fed. Sts.Middle East & North AfricaMiddle East & North Africa (excluding high income)Middle East & North Africa (IDA & IBRD countries)Middle incomeMoldovaMongoliaMontenegroMoroccoMozambiqueMyanmarNamibiaNauruNepalNetherlandsNew ZealandNicaraguaNigerNigeriaNorth AmericaNorwayOECD membersOmanOther small statesPacific island small statesPakistanPalauPanamaPapua New GuineaParaguayPeruPhilippinesPolandPortugalPost-demographic dividendPre-demographic dividendPuerto RicoQatarRomaniaRussian FederationRwandaSamoaSan MarinoSao Tome and PrincipeSaudi ArabiaSenegalSerbiaSeychellesSierra LeoneSlovak RepublicSloveniaSmall statesSolomon IslandsSomaliaSouth AfricaSouth AsiaSouth Asia (IDA & IBRD)South SudanSpainSri LankaSt. Kitts and NevisSt. LuciaSt. Vincent and the GrenadinesSub-Saharan Africa Sub-Saharan Africa (excluding high income)Sub-Saharan Africa (IDA & IBRD countries)SudanSurinameSwazilandSwedenSwitzerlandSyrian Arab RepublicTajikistanTanzaniaThailandTimor-LesteTogoTongaTrinidad and TobagoTunisiaTurkeyTurkmenistanTuvaluUgandaUkraineUnited Arab EmiratesUnited KingdomUnited StatesUpper middle incomeUruguayUzbekistanVanuatuVenezuela, RBVietnamWest Bank and GazaWorldYemen, Rep.ZambiaZimbabwe Linea del tempo:
Questa scala temporale mostra un grafico dal 1971 anno al 2015 anno. Sub-Saharan Africa (excluding high income). I dati fino ad 1970 anno non disponibili. Il numero di osservazioni attuali secondo i date: 45.
La fonte (nome):
Indicatori dello sviluppo mondiale
La fonte (organizzazione):
UNESCO Institute for Statistics
Categorie:
Education
sono stati aggiornati
23 apr 2017 anni
Indicatori delle variazioni dei valori per anni
Minima:
53.847
1 gen 1971 anni
Massimo:
98.426
1 gen 2015 anni
Alla data di osservazione
Valore
Variazione assoluta
La variazione rispetto al valore precedente
1 gen 1971 anni
53.847
+53.847
0.0%
1 gen 1972 anni
54.586
+0.74
1.37%
1 gen 1973 anni
55.801
+1.215
2.23%
1 gen 1974 anni
57.038
+1.237
2.22%
1 gen 1975 anni
59.272
+2.233
3.92%
1 gen 1976 anni
61.017
+1.746
2.95%
1 gen 1977 anni
62.351
+1.334
2.19%
1 gen 1978 anni
65.755
+3.404
5.46%
1 gen 1979 anni
69.383
+3.629
5.52%
1 gen 1980 anni
73.83
+4.447
6.41%
1 gen 1981 anni
76.899
+3.068
4.16%
1 gen 1982 anni
79.573
+2.674
3.48%
1 gen 1983 anni
81.513
+1.939
2.44%
1 gen 1984 anni
81.283
-0.229
-0.28%
1 gen 1985 anni
80.238
-1.045
-1.29%
1 gen 1986 anni
77.87
-2.369
-2.95%
1 gen 1987 anni
75.343
-2.527
-3.25%
1 gen 1988 anni
73.693
-1.649
-2.19%
1 gen 1989 anni
72.664
-1.029
-1.4%
1 gen 1990 anni
73.312
+0.648
0.89%
1 gen 1991 anni
72.529
-0.784
-1.07%
1 gen 1992 anni
73.678
+1.15
1.59%
1 gen 1993 anni
73.434
-0.244
-0.33%
1 gen 1994 anni
74.3
+0.866
1.18%
1 gen 1995 anni
74.479
+0.179
0.24%
1 gen 1996 anni
75.263
+0.784
1.05%
1 gen 1997 anni
73.419
-1.844
-2.45%
1 gen 1998 anni
76.928
+3.509
4.78%
1 gen 1999 anni
78.594
+1.666
2.17%
1 gen 2000 anni
79.136
+0.542
0.69%
1 gen 2001 anni
81.631
+2.495
3.15%
1 gen 2002 anni
83.776
+2.145
2.63%
1 gen 2003 anni
86.029
+2.253
2.69%
1 gen 2004 anni
88.631
+2.603
3.03%
1 gen 2005 anni
90.689
+2.058
2.32%
1 gen 2006 anni
92.987
+2.298
2.53%
1 gen 2007 anni
94.712
+1.725
1.85%
1 gen 2008 anni
95.47
+0.758
0.8%
1 gen 2009 anni
96.583
+1.113
1.17%
1 gen 2010 anni
96.811
+0.228
0.24%
1 gen 2011 anni
96.612
-0.199
-0.21%
1 gen 2012 anni
97.101
+0.489
0.51%
1 gen 2013 anni
97.725
+0.624
0.64%
1 gen 2014 anni
97.841
+0.116
0.12%
1 gen 2015 anni
98.426
+0.585
0.6%
Classificazione dei paesi secondo i statistiche attuali per anni


Commenti: