29
/it/
it
AIzaSyAYiBZKx7MnpbEhh9jyipgxe19OcubqV5w
April 1, 2024
107300
Colombia
COL
true
2
1
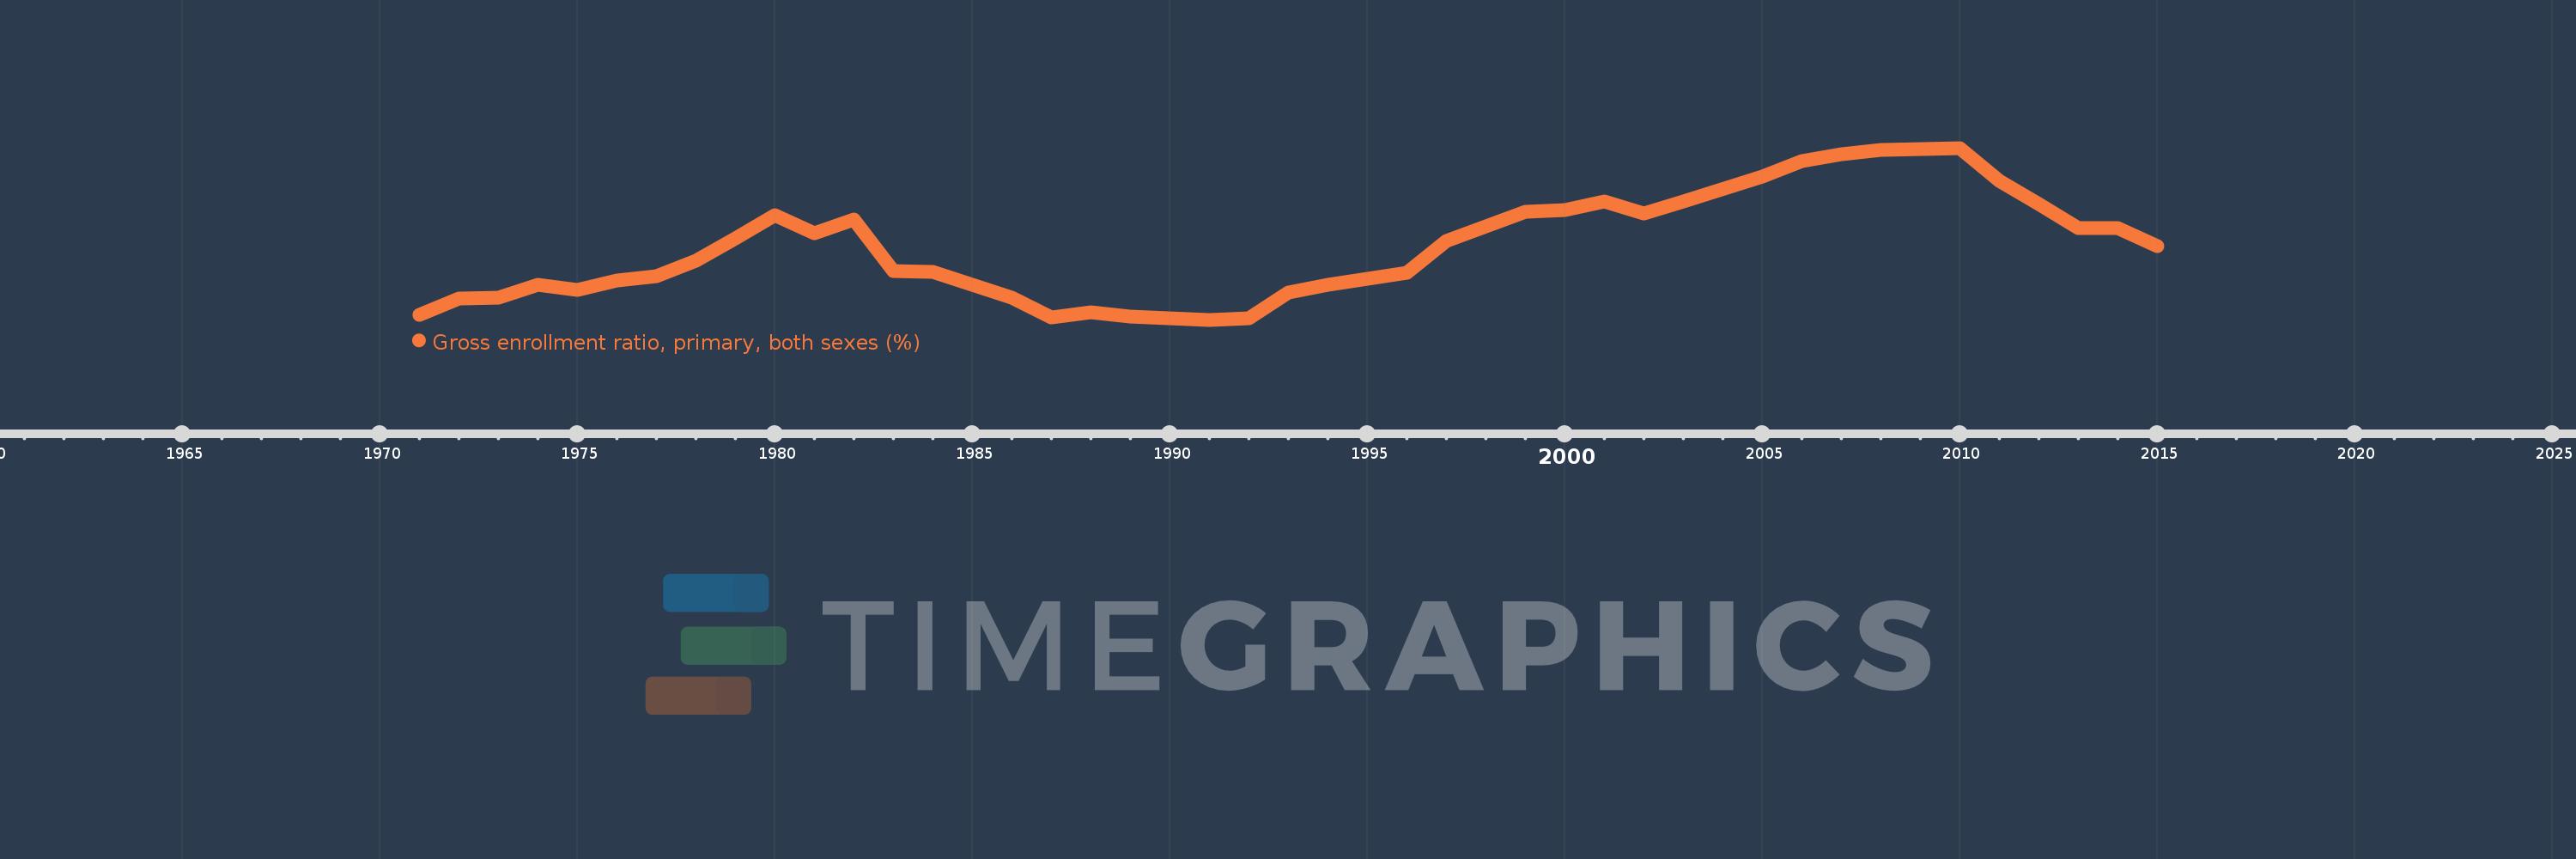
Gross enrollment ratio, primary, both sexes (%)
2015,2014,2013,2012,2011,2010,2009,2008,2007,2006,2005,2003,2002,2001,2000,1999,1997,1996,1995,1994,1993,1992,1991,1990,1989,1988,1987,1986,1985,1984,1983,1982,1981,1980,1979,1978,1977,1976,1975,1974,1973,1972,1971
Queste statistiche in altri paesi:
AfghanistanAlbaniaAlgeriaAndorraAngolaAntigua and BarbudaArab WorldArgentinaArmeniaArubaAustraliaAustriaAzerbaijanBahamas, TheBahrainBangladeshBarbadosBelarusBelgiumBelizeBeninBermudaBhutanBoliviaBosnia and HerzegovinaBotswanaBrazilBritish Virgin IslandsBrunei DarussalamBulgariaBurkina FasoBurundiCabo VerdeCambodiaCameroonCanadaCaribbean small statesCentral African RepublicCentral Europe and the BalticsChadChileChinaColombiaComorosCongo, Dem. Rep.Congo, Rep.Costa RicaCote d'IvoireCroatiaCubaCuracaoCyprusCzech RepublicDenmarkDjiboutiDominicaDominican RepublicEarly-demographic dividendEast Asia & PacificEast Asia & Pacific (excluding high income)East Asia & Pacific (IDA & IBRD countries)EcuadorEgypt, Arab Rep.El SalvadorEquatorial GuineaEritreaEstoniaEthiopiaEuro areaEurope & Central AsiaEurope & Central Asia (excluding high income)Europe & Central Asia (IDA & IBRD countries)European UnionFijiFinlandFragile and conflict affected situationsFranceGabonGambia, TheGeorgiaGermanyGhanaGreeceGrenadaGuatemalaGuineaGuinea-BissauGuyanaHaitiHeavily indebted poor countries (HIPC)High incomeHondurasHong Kong SAR, ChinaHungaryIBRD onlyIcelandIDA & IBRD totalIDA blendIDA onlyIDA totalIndiaIndonesiaIran, Islamic Rep.IraqIrelandIsraelItalyJamaicaJapanJordanKazakhstanKenyaKiribatiKorea, Dem. People’s Rep.Korea, Rep.KuwaitKyrgyz RepublicLao PDRLate-demographic dividendLatin America & Caribbean Latin America & Caribbean (excluding high income)Latin America & the Caribbean (IDA & IBRD countries)LatviaLeast developed countries: UN classificationLebanonLesothoLiberiaLibyaLiechtensteinLithuaniaLow & middle incomeLow incomeLower middle incomeLuxembourgMacao SAR, ChinaMacedonia, FYRMadagascarMalawiMalaysiaMaldivesMaliMaltaMarshall IslandsMauritaniaMauritiusMexicoMicronesia, Fed. Sts.Middle East & North AfricaMiddle East & North Africa (excluding high income)Middle East & North Africa (IDA & IBRD countries)Middle incomeMoldovaMongoliaMontenegroMoroccoMozambiqueMyanmarNamibiaNauruNepalNetherlandsNew ZealandNicaraguaNigerNigeriaNorth AmericaNorwayOECD membersOmanOther small statesPacific island small statesPakistanPalauPanamaPapua New GuineaParaguayPeruPhilippinesPolandPortugalPost-demographic dividendPre-demographic dividendPuerto RicoQatarRomaniaRussian FederationRwandaSamoaSan MarinoSao Tome and PrincipeSaudi ArabiaSenegalSerbiaSeychellesSierra LeoneSlovak RepublicSloveniaSmall statesSolomon IslandsSomaliaSouth AfricaSouth AsiaSouth Asia (IDA & IBRD)South SudanSpainSri LankaSt. Kitts and NevisSt. LuciaSt. Vincent and the GrenadinesSub-Saharan Africa Sub-Saharan Africa (excluding high income)Sub-Saharan Africa (IDA & IBRD countries)SudanSurinameSwazilandSwedenSwitzerlandSyrian Arab RepublicTajikistanTanzaniaThailandTimor-LesteTogoTongaTrinidad and TobagoTunisiaTurkeyTurkmenistanTuvaluUgandaUkraineUnited Arab EmiratesUnited KingdomUnited StatesUpper middle incomeUruguayUzbekistanVanuatuVenezuela, RBVietnamWest Bank and GazaWorldYemen, Rep.ZambiaZimbabwe Linea del tempo:
Questa scala temporale mostra un grafico dal 1971 anno al 2015 anno. Colombia. I dati fino ad 1970 anno non disponibili. Il numero di osservazioni attuali secondo i date: 43.
La fonte (nome):
Indicatori dello sviluppo mondiale
La fonte (organizzazione):
UNESCO Institute for Statistics
Categorie:
Education
sono stati aggiornati
23 apr 2017 anni
Indicatori delle variazioni dei valori per anni
Minima:
101.686
1 gen 1991 anni
Massimo:
129.685
1 gen 2010 anni
Alla data di osservazione
Valore
Variazione assoluta
La variazione rispetto al valore precedente
1 gen 1971 anni
102.52
+102.52
0.0%
1 gen 1972 anni
105.123
+2.603
2.54%
1 gen 1973 anni
105.348
+0.225
0.21%
1 gen 1974 anni
107.354
+2.006
1.9%
1 gen 1975 anni
106.61
-0.744
-0.69%
1 gen 1976 anni
108.031
+1.421
1.33%
1 gen 1977 anni
108.818
+0.787
0.73%
1 gen 1978 anni
111.291
+2.473
2.27%
1 gen 1979 anni
114.978
+3.688
3.31%
1 gen 1980 anni
118.66
+3.682
3.2%
1 gen 1981 anni
115.782
-2.878
-2.43%
1 gen 1982 anni
118.081
+2.298
1.99%
1 gen 1983 anni
109.655
-8.425
-7.14%
1 gen 1984 anni
109.415
-0.24
-0.22%
1 gen 1985 anni
107.43
-1.986
-1.82%
1 gen 1986 anni
105.35
-2.08
-1.94%
1 gen 1987 anni
102.096
-3.254
-3.09%
1 gen 1988 anni
102.869
+0.773
0.76%
1 gen 1989 anni
102.219
-0.65
-0.63%
1 gen 1990 anni
101.872
-0.347
-0.34%
1 gen 1991 anni
101.686
-0.186
-0.18%
1 gen 1992 anni
101.993
+0.307
0.3%
1 gen 1993 anni
106.149
+4.157
4.08%
1 gen 1994 anni
107.337
+1.187
1.12%
1 gen 1995 anni
108.313
+0.976
0.91%
1 gen 1996 anni
109.364
+1.051
0.97%
1 gen 1997 anni
114.576
+5.212
4.77%
1 gen 1999 anni
119.293
+4.718
4.12%
1 gen 2000 anni
119.632
+0.339
0.28%
1 gen 2001 anni
120.911
+1.279
1.07%
1 gen 2002 anni
118.982
-1.929
-1.6%
1 gen 2003 anni
120.987
+2.005
1.69%
1 gen 2005 anni
125.022
+4.035
3.33%
1 gen 2006 anni
127.504
+2.483
1.99%
1 gen 2007 anni
128.716
+1.212
0.95%
1 gen 2008 anni
129.415
+0.699
0.54%
1 gen 2009 anni
129.499
+0.084
0.06%
1 gen 2010 anni
129.685
+0.186
0.14%
1 gen 2011 anni
124.285
-5.401
-4.16%
1 gen 2012 anni
120.519
-3.766
-3.03%
1 gen 2013 anni
116.561
-3.958
-3.28%
1 gen 2014 anni
116.621
+0.06
0.05%
1 gen 2015 anni
113.747
-2.874
-2.46%
Classificazione dei paesi secondo i statistiche attuali per anni


Commenti: