29
/it/
it
AIzaSyAYiBZKx7MnpbEhh9jyipgxe19OcubqV5w
April 1, 2024
54091
Pacific island small states
PSS
false
2
1
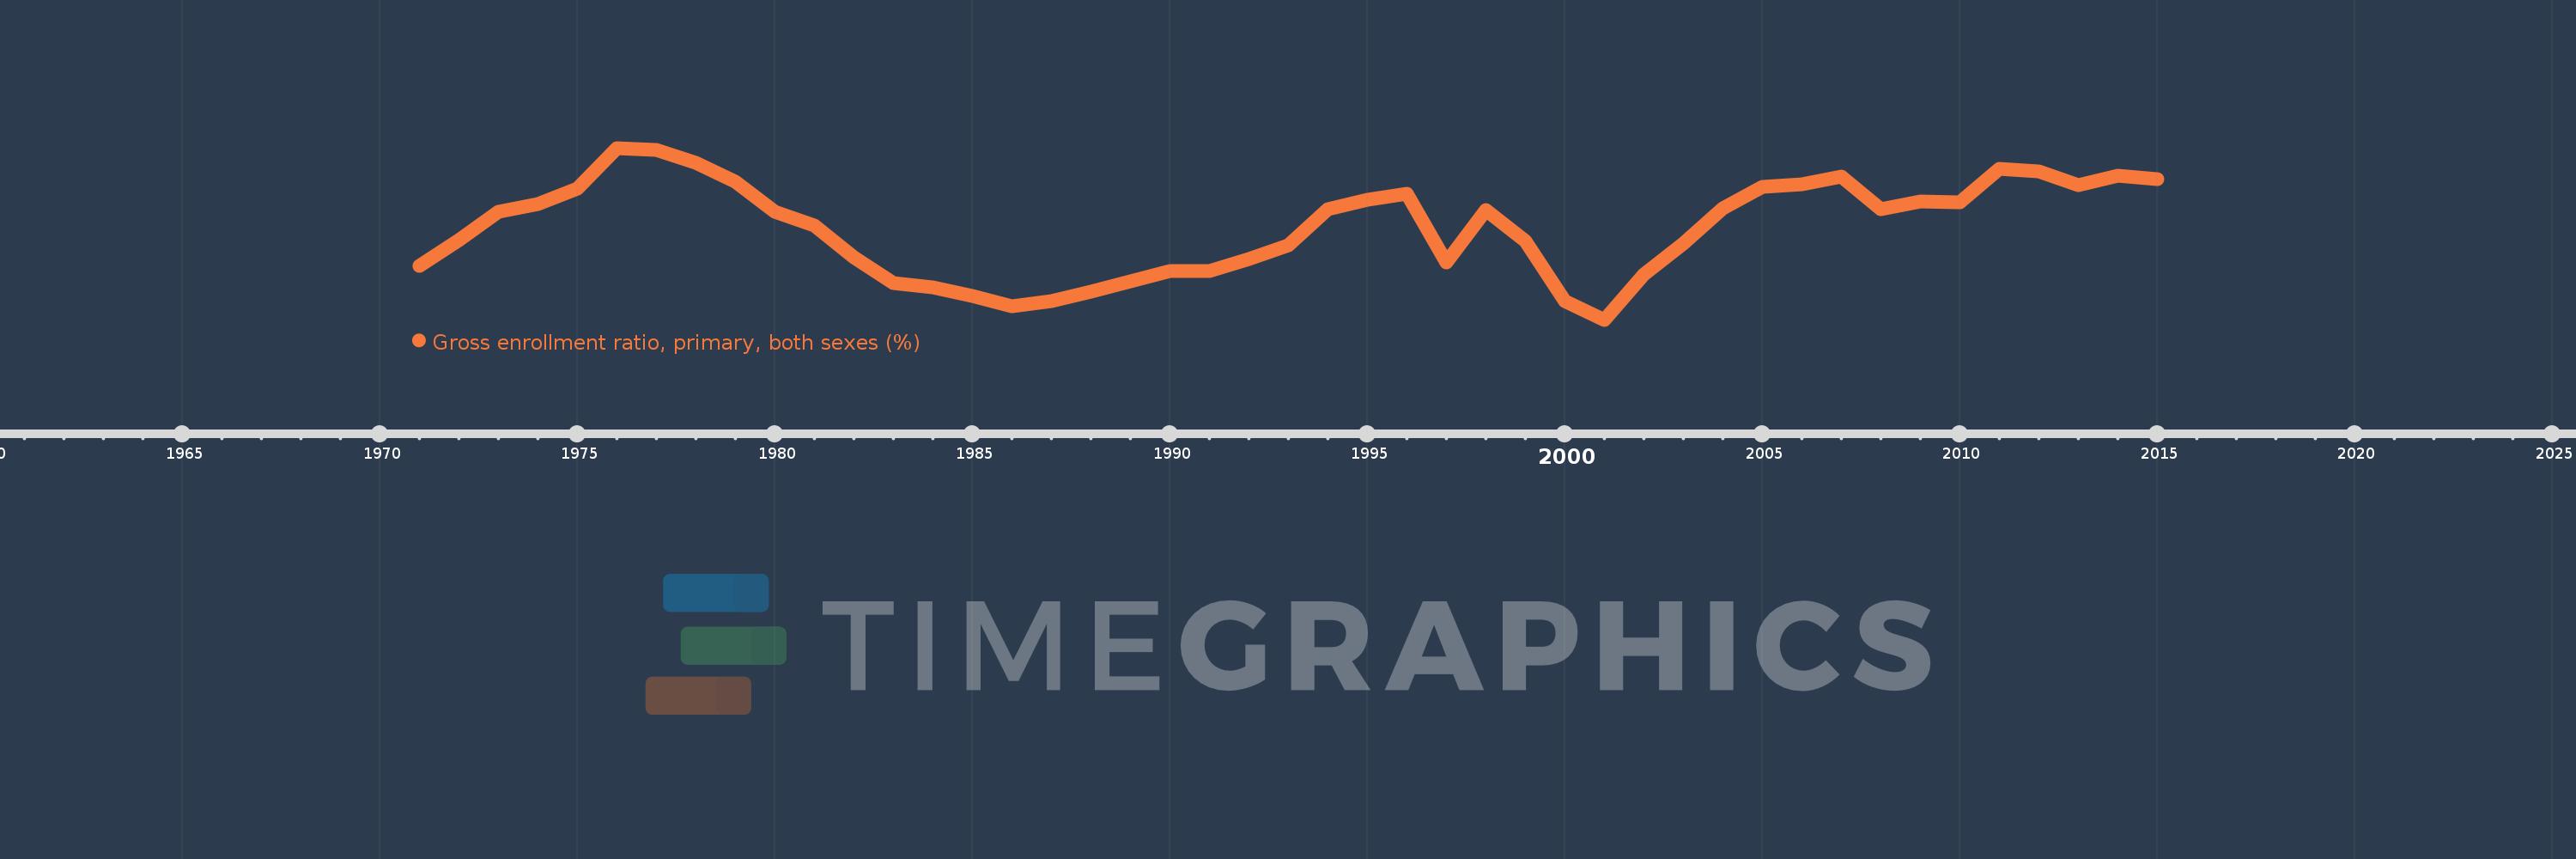
Gross enrollment ratio, primary, both sexes (%)
2015,2014,2013,2012,2011,2010,2009,2008,2007,2006,2005,2004,2003,2002,2001,2000,1999,1998,1997,1996,1995,1994,1993,1992,1991,1990,1989,1988,1987,1986,1985,1984,1983,1982,1981,1980,1979,1978,1977,1976,1975,1974,1973,1972,1971
Queste statistiche in altri paesi:
AfghanistanAlbaniaAlgeriaAndorraAngolaAntigua and BarbudaArab WorldArgentinaArmeniaArubaAustraliaAustriaAzerbaijanBahamas, TheBahrainBangladeshBarbadosBelarusBelgiumBelizeBeninBermudaBhutanBoliviaBosnia and HerzegovinaBotswanaBrazilBritish Virgin IslandsBrunei DarussalamBulgariaBurkina FasoBurundiCabo VerdeCambodiaCameroonCanadaCaribbean small statesCentral African RepublicCentral Europe and the BalticsChadChileChinaColombiaComorosCongo, Dem. Rep.Congo, Rep.Costa RicaCote d'IvoireCroatiaCubaCuracaoCyprusCzech RepublicDenmarkDjiboutiDominicaDominican RepublicEarly-demographic dividendEast Asia & PacificEast Asia & Pacific (excluding high income)East Asia & Pacific (IDA & IBRD countries)EcuadorEgypt, Arab Rep.El SalvadorEquatorial GuineaEritreaEstoniaEthiopiaEuro areaEurope & Central AsiaEurope & Central Asia (excluding high income)Europe & Central Asia (IDA & IBRD countries)European UnionFijiFinlandFragile and conflict affected situationsFranceGabonGambia, TheGeorgiaGermanyGhanaGreeceGrenadaGuatemalaGuineaGuinea-BissauGuyanaHaitiHeavily indebted poor countries (HIPC)High incomeHondurasHong Kong SAR, ChinaHungaryIBRD onlyIcelandIDA & IBRD totalIDA blendIDA onlyIDA totalIndiaIndonesiaIran, Islamic Rep.IraqIrelandIsraelItalyJamaicaJapanJordanKazakhstanKenyaKiribatiKorea, Dem. People’s Rep.Korea, Rep.KuwaitKyrgyz RepublicLao PDRLate-demographic dividendLatin America & Caribbean Latin America & Caribbean (excluding high income)Latin America & the Caribbean (IDA & IBRD countries)LatviaLeast developed countries: UN classificationLebanonLesothoLiberiaLibyaLiechtensteinLithuaniaLow & middle incomeLow incomeLower middle incomeLuxembourgMacao SAR, ChinaMacedonia, FYRMadagascarMalawiMalaysiaMaldivesMaliMaltaMarshall IslandsMauritaniaMauritiusMexicoMicronesia, Fed. Sts.Middle East & North AfricaMiddle East & North Africa (excluding high income)Middle East & North Africa (IDA & IBRD countries)Middle incomeMoldovaMongoliaMontenegroMoroccoMozambiqueMyanmarNamibiaNauruNepalNetherlandsNew ZealandNicaraguaNigerNigeriaNorth AmericaNorwayOECD membersOmanOther small statesPacific island small statesPakistanPalauPanamaPapua New GuineaParaguayPeruPhilippinesPolandPortugalPost-demographic dividendPre-demographic dividendPuerto RicoQatarRomaniaRussian FederationRwandaSamoaSan MarinoSao Tome and PrincipeSaudi ArabiaSenegalSerbiaSeychellesSierra LeoneSlovak RepublicSloveniaSmall statesSolomon IslandsSomaliaSouth AfricaSouth AsiaSouth Asia (IDA & IBRD)South SudanSpainSri LankaSt. Kitts and NevisSt. LuciaSt. Vincent and the GrenadinesSub-Saharan Africa Sub-Saharan Africa (excluding high income)Sub-Saharan Africa (IDA & IBRD countries)SudanSurinameSwazilandSwedenSwitzerlandSyrian Arab RepublicTajikistanTanzaniaThailandTimor-LesteTogoTongaTrinidad and TobagoTunisiaTurkeyTurkmenistanTuvaluUgandaUkraineUnited Arab EmiratesUnited KingdomUnited StatesUpper middle incomeUruguayUzbekistanVanuatuVenezuela, RBVietnamWest Bank and GazaWorldYemen, Rep.ZambiaZimbabwe Linea del tempo:
Questa scala temporale mostra un grafico dal 1971 anno al 2015 anno. Pacific island small states. I dati fino ad 1970 anno non disponibili. Il numero di osservazioni attuali secondo i date: 45.
La fonte (nome):
Indicatori dello sviluppo mondiale
La fonte (organizzazione):
UNESCO Institute for Statistics
Categorie:
Education
sono stati aggiornati
23 apr 2017 anni
Indicatori delle variazioni dei valori per anni
Minima:
101.735
1 gen 2001 anni
Massimo:
112.074
1 gen 1976 anni
Alla data di osservazione
Valore
Variazione assoluta
La variazione rispetto al valore precedente
1 gen 1971 anni
104.996
+104.996
0.0%
1 gen 1972 anni
106.539
+1.543
1.47%
1 gen 1973 anni
108.223
+1.685
1.58%
1 gen 1974 anni
108.683
+0.46
0.42%
1 gen 1975 anni
109.608
+0.925
0.85%
1 gen 1976 anni
112.074
+2.466
2.25%
1 gen 1977 anni
111.941
-0.132
-0.12%
1 gen 1978 anni
111.19
-0.752
-0.67%
1 gen 1979 anni
110.037
-1.152
-1.04%
1 gen 1980 anni
108.258
-1.78
-1.62%
1 gen 1981 anni
107.414
-0.844
-0.78%
1 gen 1982 anni
105.493
-1.921
-1.79%
1 gen 1983 anni
103.923
-1.57
-1.49%
1 gen 1984 anni
103.661
-0.261
-0.25%
1 gen 1985 anni
103.171
-0.491
-0.47%
1 gen 1986 anni
102.544
-0.626
-0.61%
1 gen 1987 anni
102.876
+0.332
0.32%
1 gen 1988 anni
103.447
+0.571
0.56%
1 gen 1989 anni
104.071
+0.624
0.6%
1 gen 1990 anni
104.649
+0.577
0.55%
1 gen 1991 anni
104.683
+0.034
0.03%
1 gen 1992 anni
105.4
+0.717
0.68%
1 gen 1993 anni
106.237
+0.837
0.79%
1 gen 1994 anni
108.367
+2.13
2.0%
1 gen 1995 anni
108.97
+0.603
0.56%
1 gen 1996 anni
109.338
+0.368
0.34%
1 gen 1997 anni
105.207
-4.131
-3.78%
1 gen 1998 anni
108.342
+3.135
2.98%
1 gen 1999 anni
106.48
-1.862
-1.72%
1 gen 2000 anni
102.862
-3.618
-3.4%
1 gen 2001 anni
101.735
-1.127
-1.1%
1 gen 2002 anni
104.474
+2.739
2.69%
1 gen 2003 anni
106.326
+1.852
1.77%
1 gen 2004 anni
108.448
+2.122
2.0%
1 gen 2005 anni
109.721
+1.274
1.17%
1 gen 2006 anni
109.87
+0.149
0.14%
1 gen 2007 anni
110.363
+0.493
0.45%
1 gen 2008 anni
108.403
-1.96
-1.78%
1 gen 2009 anni
108.84
+0.437
0.4%
1 gen 2010 anni
108.779
-0.061
-0.06%
1 gen 2011 anni
110.8
+2.021
1.86%
1 gen 2012 anni
110.645
-0.155
-0.14%
1 gen 2013 anni
109.83
-0.815
-0.74%
1 gen 2014 anni
110.42
+0.59
0.54%
1 gen 2015 anni
110.223
-0.197
-0.18%
Classificazione dei paesi secondo i statistiche attuali per anni


Commenti: