29
/it/
it
AIzaSyAYiBZKx7MnpbEhh9jyipgxe19OcubqV5w
April 1, 2024
25733
Central Europe and the Baltics
CEB
false
2
1
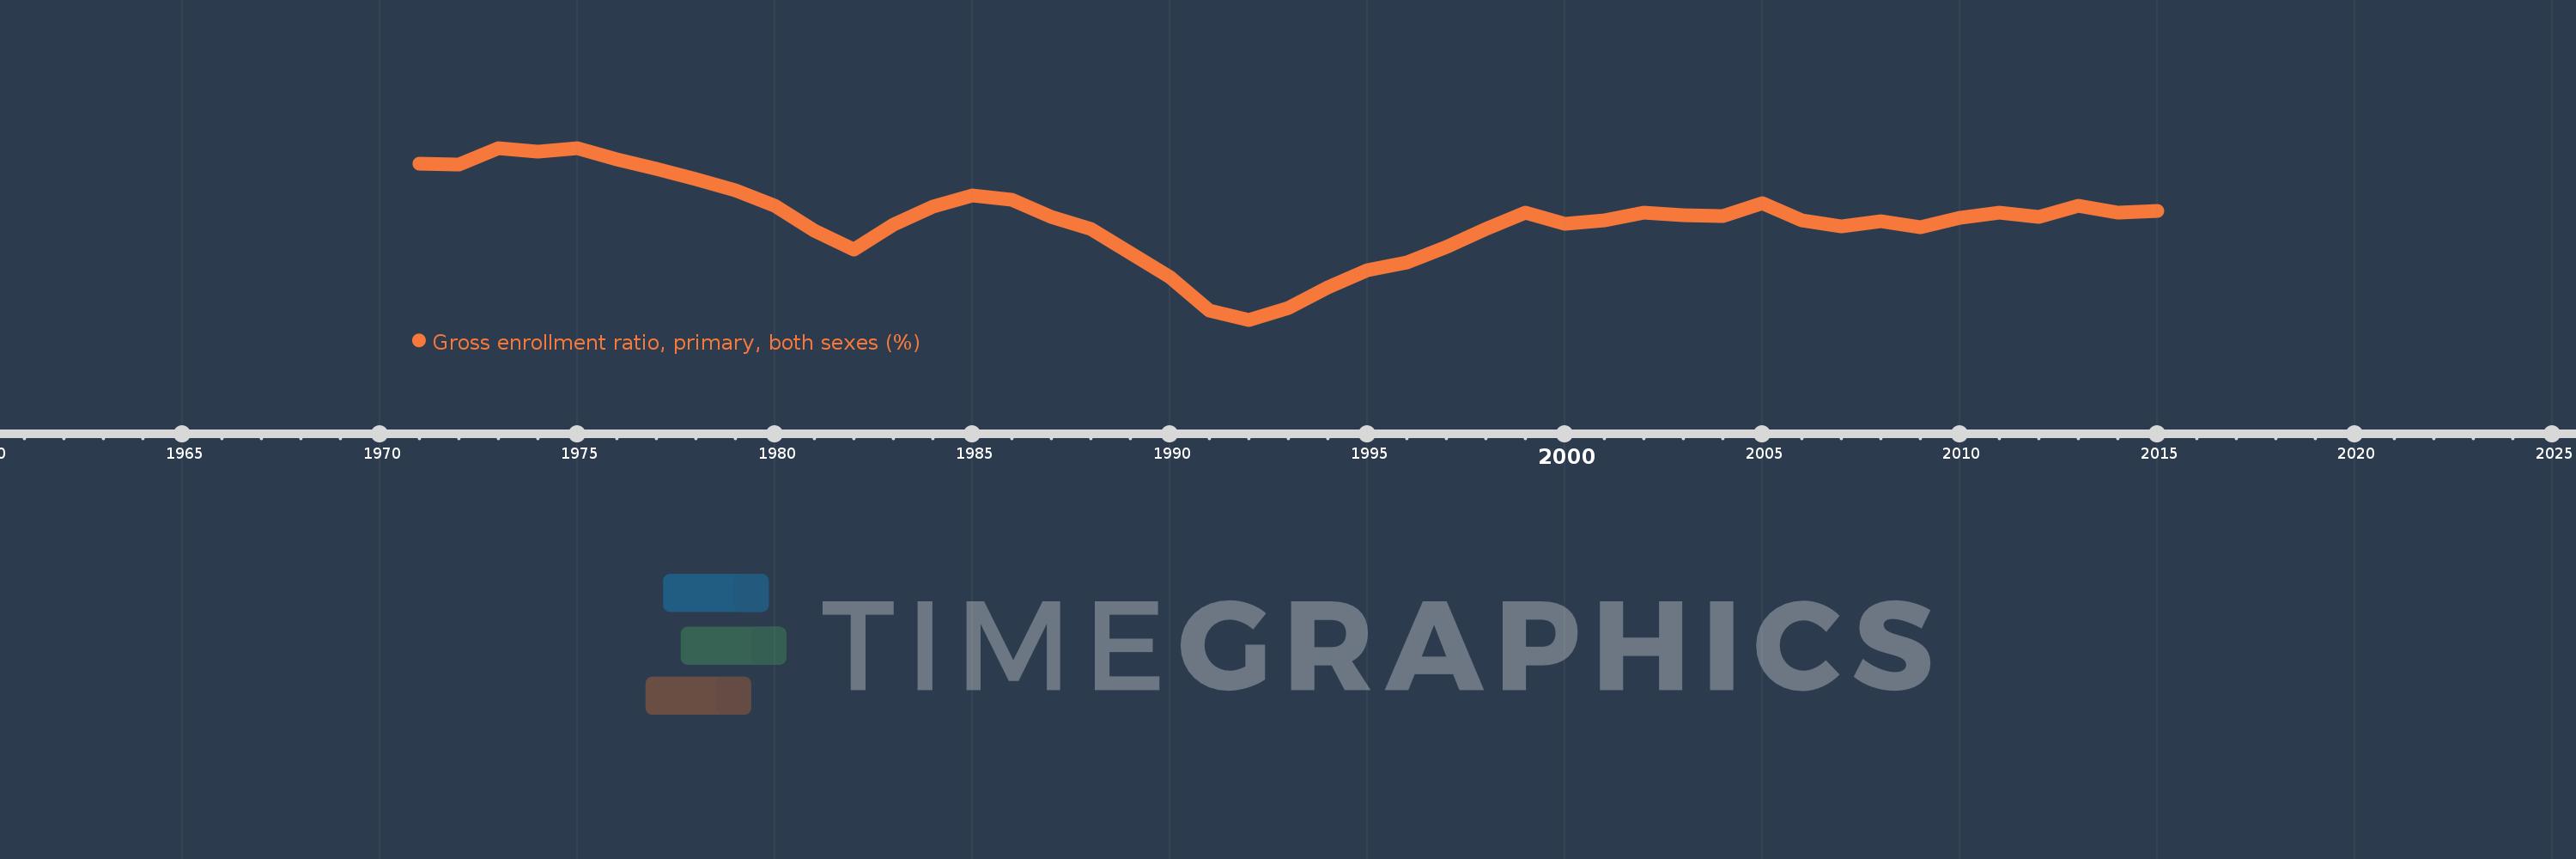
Gross enrollment ratio, primary, both sexes (%)
2015,2014,2013,2012,2011,2010,2009,2008,2007,2006,2005,2004,2003,2002,2001,2000,1999,1998,1997,1996,1995,1994,1993,1992,1991,1990,1989,1988,1987,1986,1985,1984,1983,1982,1981,1980,1979,1978,1977,1976,1975,1974,1973,1972,1971
Queste statistiche in altri paesi:
AfghanistanAlbaniaAlgeriaAndorraAngolaAntigua and BarbudaArab WorldArgentinaArmeniaArubaAustraliaAustriaAzerbaijanBahamas, TheBahrainBangladeshBarbadosBelarusBelgiumBelizeBeninBermudaBhutanBoliviaBosnia and HerzegovinaBotswanaBrazilBritish Virgin IslandsBrunei DarussalamBulgariaBurkina FasoBurundiCabo VerdeCambodiaCameroonCanadaCaribbean small statesCentral African RepublicCentral Europe and the BalticsChadChileChinaColombiaComorosCongo, Dem. Rep.Congo, Rep.Costa RicaCote d'IvoireCroatiaCubaCuracaoCyprusCzech RepublicDenmarkDjiboutiDominicaDominican RepublicEarly-demographic dividendEast Asia & PacificEast Asia & Pacific (excluding high income)East Asia & Pacific (IDA & IBRD countries)EcuadorEgypt, Arab Rep.El SalvadorEquatorial GuineaEritreaEstoniaEthiopiaEuro areaEurope & Central AsiaEurope & Central Asia (excluding high income)Europe & Central Asia (IDA & IBRD countries)European UnionFijiFinlandFragile and conflict affected situationsFranceGabonGambia, TheGeorgiaGermanyGhanaGreeceGrenadaGuatemalaGuineaGuinea-BissauGuyanaHaitiHeavily indebted poor countries (HIPC)High incomeHondurasHong Kong SAR, ChinaHungaryIBRD onlyIcelandIDA & IBRD totalIDA blendIDA onlyIDA totalIndiaIndonesiaIran, Islamic Rep.IraqIrelandIsraelItalyJamaicaJapanJordanKazakhstanKenyaKiribatiKorea, Dem. People’s Rep.Korea, Rep.KuwaitKyrgyz RepublicLao PDRLate-demographic dividendLatin America & Caribbean Latin America & Caribbean (excluding high income)Latin America & the Caribbean (IDA & IBRD countries)LatviaLeast developed countries: UN classificationLebanonLesothoLiberiaLibyaLiechtensteinLithuaniaLow & middle incomeLow incomeLower middle incomeLuxembourgMacao SAR, ChinaMacedonia, FYRMadagascarMalawiMalaysiaMaldivesMaliMaltaMarshall IslandsMauritaniaMauritiusMexicoMicronesia, Fed. Sts.Middle East & North AfricaMiddle East & North Africa (excluding high income)Middle East & North Africa (IDA & IBRD countries)Middle incomeMoldovaMongoliaMontenegroMoroccoMozambiqueMyanmarNamibiaNauruNepalNetherlandsNew ZealandNicaraguaNigerNigeriaNorth AmericaNorwayOECD membersOmanOther small statesPacific island small statesPakistanPalauPanamaPapua New GuineaParaguayPeruPhilippinesPolandPortugalPost-demographic dividendPre-demographic dividendPuerto RicoQatarRomaniaRussian FederationRwandaSamoaSan MarinoSao Tome and PrincipeSaudi ArabiaSenegalSerbiaSeychellesSierra LeoneSlovak RepublicSloveniaSmall statesSolomon IslandsSomaliaSouth AfricaSouth AsiaSouth Asia (IDA & IBRD)South SudanSpainSri LankaSt. Kitts and NevisSt. LuciaSt. Vincent and the GrenadinesSub-Saharan Africa Sub-Saharan Africa (excluding high income)Sub-Saharan Africa (IDA & IBRD countries)SudanSurinameSwazilandSwedenSwitzerlandSyrian Arab RepublicTajikistanTanzaniaThailandTimor-LesteTogoTongaTrinidad and TobagoTunisiaTurkeyTurkmenistanTuvaluUgandaUkraineUnited Arab EmiratesUnited KingdomUnited StatesUpper middle incomeUruguayUzbekistanVanuatuVenezuela, RBVietnamWest Bank and GazaWorldYemen, Rep.ZambiaZimbabwe Linea del tempo:
Questa scala temporale mostra un grafico dal 1971 anno al 2015 anno. Central Europe and the Baltics. I dati fino ad 1970 anno non disponibili. Il numero di osservazioni attuali secondo i date: 45.
La fonte (nome):
Indicatori dello sviluppo mondiale
La fonte (organizzazione):
UNESCO Institute for Statistics
Categorie:
Education
sono stati aggiornati
23 apr 2017 anni
Indicatori delle variazioni dei valori per anni
Minima:
93.998
1 gen 1992 anni
Massimo:
102.901
1 gen 1973 anni
Alla data di osservazione
Valore
Variazione assoluta
La variazione rispetto al valore precedente
1 gen 1971 anni
102.079
+102.079
0.0%
1 gen 1972 anni
102.061
-0.018
-0.02%
1 gen 1973 anni
102.901
+0.841
0.82%
1 gen 1974 anni
102.727
-0.174
-0.17%
1 gen 1975 anni
102.866
+0.139
0.14%
1 gen 1976 anni
102.323
-0.543
-0.53%
1 gen 1977 anni
101.805
-0.519
-0.51%
1 gen 1978 anni
101.283
-0.522
-0.51%
1 gen 1979 anni
100.718
-0.565
-0.56%
1 gen 1980 anni
99.912
-0.806
-0.8%
1 gen 1981 anni
98.6
-1.312
-1.31%
1 gen 1982 anni
97.636
-0.964
-0.98%
1 gen 1983 anni
98.928
+1.293
1.32%
1 gen 1984 anni
99.881
+0.952
0.96%
1 gen 1985 anni
100.43
+0.55
0.55%
1 gen 1986 anni
100.218
-0.212
-0.21%
1 gen 1987 anni
99.347
-0.871
-0.87%
1 gen 1988 anni
98.714
-0.634
-0.64%
1 gen 1989 anni
97.44
-1.274
-1.29%
1 gen 1990 anni
96.2
-1.24
-1.27%
1 gen 1991 anni
94.464
-1.736
-1.8%
1 gen 1992 anni
93.998
-0.466
-0.49%
1 gen 1993 anni
94.605
+0.607
0.65%
1 gen 1994 anni
95.663
+1.058
1.12%
1 gen 1995 anni
96.576
+0.914
0.96%
1 gen 1996 anni
96.98
+0.403
0.42%
1 gen 1997 anni
97.76
+0.78
0.8%
1 gen 1998 anni
98.7
+0.94
0.96%
1 gen 1999 anni
99.529
+0.829
0.84%
1 gen 2000 anni
98.963
-0.566
-0.57%
1 gen 2001 anni
99.16
+0.197
0.2%
1 gen 2002 anni
99.549
+0.389
0.39%
1 gen 2003 anni
99.401
-0.148
-0.15%
1 gen 2004 anni
99.381
-0.02
-0.02%
1 gen 2005 anni
100.021
+0.64
0.64%
1 gen 2006 anni
99.16
-0.861
-0.86%
1 gen 2007 anni
98.824
-0.336
-0.34%
1 gen 2008 anni
99.105
+0.281
0.28%
1 gen 2009 anni
98.794
-0.311
-0.31%
1 gen 2010 anni
99.281
+0.487
0.49%
1 gen 2011 anni
99.531
+0.25
0.25%
1 gen 2012 anni
99.328
-0.203
-0.2%
1 gen 2013 anni
99.9
+0.572
0.58%
1 gen 2014 anni
99.555
-0.345
-0.35%
1 gen 2015 anni
99.647
+0.092
0.09%
Classificazione dei paesi secondo i statistiche attuali per anni


Commenti: