29
/it/
it
AIzaSyAYiBZKx7MnpbEhh9jyipgxe19OcubqV5w
April 1, 2024
220887
Paraguay
PRY
true
2
1
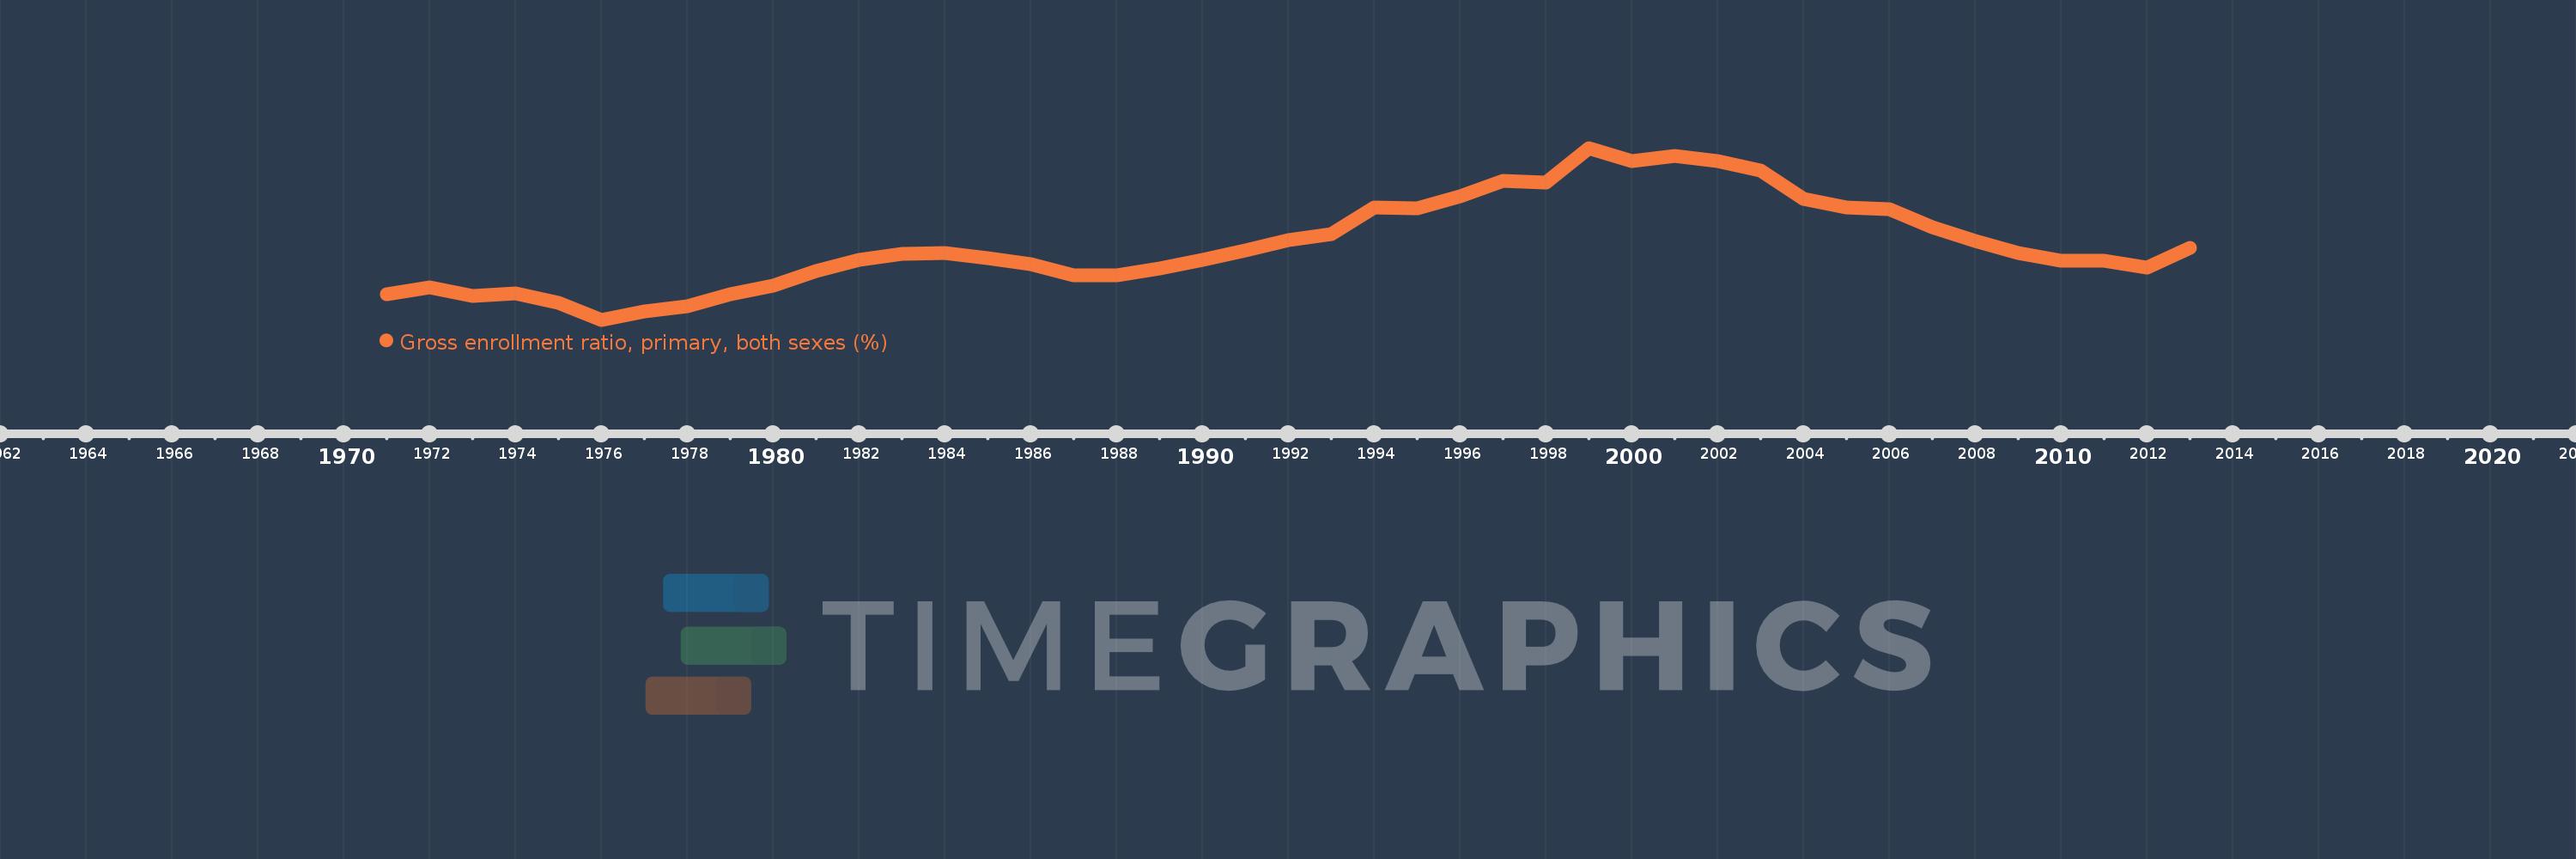
Gross enrollment ratio, primary, both sexes (%)
2013,2012,2011,2010,2009,2008,2007,2006,2005,2004,2003,2002,2001,2000,1999,1998,1997,1996,1995,1994,1993,1992,1991,1990,1989,1988,1987,1986,1985,1984,1983,1982,1981,1980,1979,1978,1977,1976,1975,1974,1973,1972,1971
Queste statistiche in altri paesi:
AfghanistanAlbaniaAlgeriaAndorraAngolaAntigua and BarbudaArab WorldArgentinaArmeniaArubaAustraliaAustriaAzerbaijanBahamas, TheBahrainBangladeshBarbadosBelarusBelgiumBelizeBeninBermudaBhutanBoliviaBosnia and HerzegovinaBotswanaBrazilBritish Virgin IslandsBrunei DarussalamBulgariaBurkina FasoBurundiCabo VerdeCambodiaCameroonCanadaCaribbean small statesCentral African RepublicCentral Europe and the BalticsChadChileChinaColombiaComorosCongo, Dem. Rep.Congo, Rep.Costa RicaCote d'IvoireCroatiaCubaCuracaoCyprusCzech RepublicDenmarkDjiboutiDominicaDominican RepublicEarly-demographic dividendEast Asia & PacificEast Asia & Pacific (excluding high income)East Asia & Pacific (IDA & IBRD countries)EcuadorEgypt, Arab Rep.El SalvadorEquatorial GuineaEritreaEstoniaEthiopiaEuro areaEurope & Central AsiaEurope & Central Asia (excluding high income)Europe & Central Asia (IDA & IBRD countries)European UnionFijiFinlandFragile and conflict affected situationsFranceGabonGambia, TheGeorgiaGermanyGhanaGreeceGrenadaGuatemalaGuineaGuinea-BissauGuyanaHaitiHeavily indebted poor countries (HIPC)High incomeHondurasHong Kong SAR, ChinaHungaryIBRD onlyIcelandIDA & IBRD totalIDA blendIDA onlyIDA totalIndiaIndonesiaIran, Islamic Rep.IraqIrelandIsraelItalyJamaicaJapanJordanKazakhstanKenyaKiribatiKorea, Dem. People’s Rep.Korea, Rep.KuwaitKyrgyz RepublicLao PDRLate-demographic dividendLatin America & Caribbean Latin America & Caribbean (excluding high income)Latin America & the Caribbean (IDA & IBRD countries)LatviaLeast developed countries: UN classificationLebanonLesothoLiberiaLibyaLiechtensteinLithuaniaLow & middle incomeLow incomeLower middle incomeLuxembourgMacao SAR, ChinaMacedonia, FYRMadagascarMalawiMalaysiaMaldivesMaliMaltaMarshall IslandsMauritaniaMauritiusMexicoMicronesia, Fed. Sts.Middle East & North AfricaMiddle East & North Africa (excluding high income)Middle East & North Africa (IDA & IBRD countries)Middle incomeMoldovaMongoliaMontenegroMoroccoMozambiqueMyanmarNamibiaNauruNepalNetherlandsNew ZealandNicaraguaNigerNigeriaNorth AmericaNorwayOECD membersOmanOther small statesPacific island small statesPakistanPalauPanamaPapua New GuineaParaguayPeruPhilippinesPolandPortugalPost-demographic dividendPre-demographic dividendPuerto RicoQatarRomaniaRussian FederationRwandaSamoaSan MarinoSao Tome and PrincipeSaudi ArabiaSenegalSerbiaSeychellesSierra LeoneSlovak RepublicSloveniaSmall statesSolomon IslandsSomaliaSouth AfricaSouth AsiaSouth Asia (IDA & IBRD)South SudanSpainSri LankaSt. Kitts and NevisSt. LuciaSt. Vincent and the GrenadinesSub-Saharan Africa Sub-Saharan Africa (excluding high income)Sub-Saharan Africa (IDA & IBRD countries)SudanSurinameSwazilandSwedenSwitzerlandSyrian Arab RepublicTajikistanTanzaniaThailandTimor-LesteTogoTongaTrinidad and TobagoTunisiaTurkeyTurkmenistanTuvaluUgandaUkraineUnited Arab EmiratesUnited KingdomUnited StatesUpper middle incomeUruguayUzbekistanVanuatuVenezuela, RBVietnamWest Bank and GazaWorldYemen, Rep.ZambiaZimbabwe Linea del tempo:
Questa scala temporale mostra un grafico dal 1971 anno al 2013 anno. Paraguay. I dati fino ad 1970 anno non disponibili. Il numero di osservazioni attuali secondo i date: 43.
La fonte (nome):
Indicatori dello sviluppo mondiale
La fonte (organizzazione):
UNESCO Institute for Statistics
Categorie:
Education
sono stati aggiornati
23 apr 2017 anni
Indicatori delle variazioni dei valori per anni
Minima:
94.831
1 gen 1976 anni
Massimo:
121.454
1 gen 1999 anni
Alla data di osservazione
Valore
Variazione assoluta
La variazione rispetto al valore precedente
1 gen 1971 anni
98.822
+98.822
0.0%
1 gen 1972 anni
99.898
+1.076
1.09%
1 gen 1973 anni
98.576
-1.322
-1.32%
1 gen 1974 anni
98.915
+0.339
0.34%
1 gen 1975 anni
97.479
-1.436
-1.45%
1 gen 1976 anni
94.831
-2.649
-2.72%
1 gen 1977 anni
96.175
+1.344
1.42%
1 gen 1978 anni
96.927
+0.751
0.78%
1 gen 1979 anni
98.735
+1.808
1.87%
1 gen 1980 anni
100.093
+1.358
1.38%
1 gen 1981 anni
102.37
+2.277
2.28%
1 gen 1982 anni
104.174
+1.804
1.76%
1 gen 1983 anni
105.1
+0.926
0.89%
1 gen 1984 anni
105.158
+0.058
0.05%
1 gen 1985 anni
104.402
-0.756
-0.72%
1 gen 1986 anni
103.397
-1.004
-0.96%
1 gen 1987 anni
101.692
-1.705
-1.65%
1 gen 1988 anni
101.777
+0.085
0.08%
1 gen 1989 anni
102.824
+1.047
1.03%
1 gen 1990 anni
104.158
+1.333
1.3%
1 gen 1991 anni
105.516
+1.358
1.3%
1 gen 1992 anni
107.158
+1.642
1.56%
1 gen 1993 anni
108.074
+0.916
0.85%
1 gen 1994 anni
112.169
+4.095
3.79%
1 gen 1995 anni
112.072
-0.097
-0.09%
1 gen 1996 anni
113.937
+1.865
1.66%
1 gen 1997 anni
116.403
+2.465
2.16%
1 gen 1998 anni
116.094
-0.309
-0.27%
1 gen 1999 anni
121.454
+5.36
4.62%
1 gen 2000 anni
119.364
-2.09
-1.72%
1 gen 2001 anni
120.243
+0.88
0.74%
1 gen 2002 anni
119.364
-0.879
-0.73%
1 gen 2003 anni
117.898
-1.466
-1.23%
1 gen 2004 anni
113.618
-4.28
-3.63%
1 gen 2005 anni
112.167
-1.452
-1.28%
1 gen 2006 anni
111.939
-0.228
-0.2%
1 gen 2007 anni
109.109
-2.83
-2.53%
1 gen 2008 anni
106.985
-2.124
-1.95%
1 gen 2009 anni
105.234
-1.752
-1.64%
1 gen 2010 anni
104.011
-1.223
-1.16%
1 gen 2011 anni
103.926
-0.085
-0.08%
1 gen 2012 anni
102.948
-0.979
-0.94%
1 gen 2013 anni
105.986
+3.039
2.95%
Classificazione dei paesi secondo i statistiche attuali per anni


Commenti: