29
/it/
it
AIzaSyAYiBZKx7MnpbEhh9jyipgxe19OcubqV5w
April 1, 2024
48159
Middle East & North Africa
MEA
false
2
1
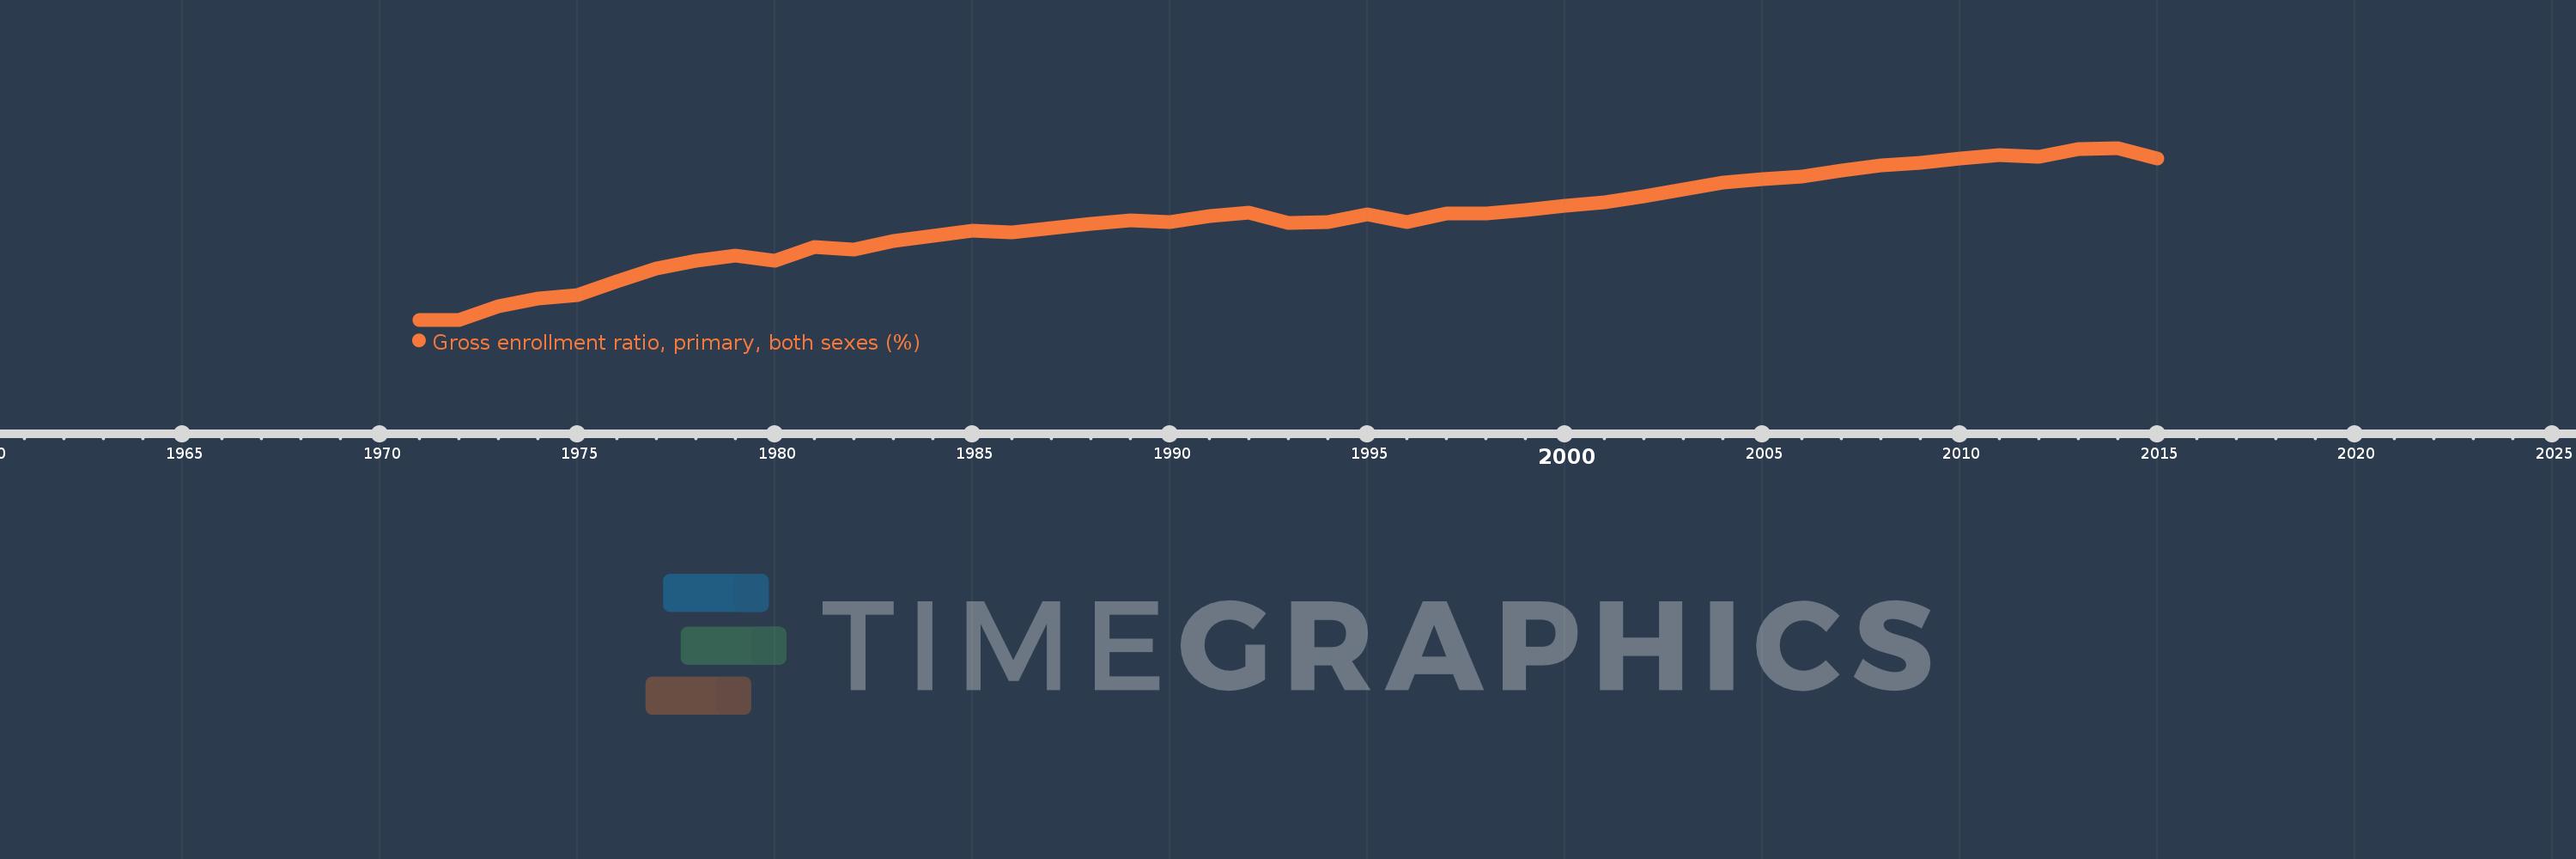
Gross enrollment ratio, primary, both sexes (%)
2015,2014,2013,2012,2011,2010,2009,2008,2007,2006,2005,2004,2003,2002,2001,2000,1999,1998,1997,1996,1995,1994,1993,1992,1991,1990,1989,1988,1987,1986,1985,1984,1983,1982,1981,1980,1979,1978,1977,1976,1975,1974,1973,1972,1971
Queste statistiche in altri paesi:
AfghanistanAlbaniaAlgeriaAndorraAngolaAntigua and BarbudaArab WorldArgentinaArmeniaArubaAustraliaAustriaAzerbaijanBahamas, TheBahrainBangladeshBarbadosBelarusBelgiumBelizeBeninBermudaBhutanBoliviaBosnia and HerzegovinaBotswanaBrazilBritish Virgin IslandsBrunei DarussalamBulgariaBurkina FasoBurundiCabo VerdeCambodiaCameroonCanadaCaribbean small statesCentral African RepublicCentral Europe and the BalticsChadChileChinaColombiaComorosCongo, Dem. Rep.Congo, Rep.Costa RicaCote d'IvoireCroatiaCubaCuracaoCyprusCzech RepublicDenmarkDjiboutiDominicaDominican RepublicEarly-demographic dividendEast Asia & PacificEast Asia & Pacific (excluding high income)East Asia & Pacific (IDA & IBRD countries)EcuadorEgypt, Arab Rep.El SalvadorEquatorial GuineaEritreaEstoniaEthiopiaEuro areaEurope & Central AsiaEurope & Central Asia (excluding high income)Europe & Central Asia (IDA & IBRD countries)European UnionFijiFinlandFragile and conflict affected situationsFranceGabonGambia, TheGeorgiaGermanyGhanaGreeceGrenadaGuatemalaGuineaGuinea-BissauGuyanaHaitiHeavily indebted poor countries (HIPC)High incomeHondurasHong Kong SAR, ChinaHungaryIBRD onlyIcelandIDA & IBRD totalIDA blendIDA onlyIDA totalIndiaIndonesiaIran, Islamic Rep.IraqIrelandIsraelItalyJamaicaJapanJordanKazakhstanKenyaKiribatiKorea, Dem. People’s Rep.Korea, Rep.KuwaitKyrgyz RepublicLao PDRLate-demographic dividendLatin America & Caribbean Latin America & Caribbean (excluding high income)Latin America & the Caribbean (IDA & IBRD countries)LatviaLeast developed countries: UN classificationLebanonLesothoLiberiaLibyaLiechtensteinLithuaniaLow & middle incomeLow incomeLower middle incomeLuxembourgMacao SAR, ChinaMacedonia, FYRMadagascarMalawiMalaysiaMaldivesMaliMaltaMarshall IslandsMauritaniaMauritiusMexicoMicronesia, Fed. Sts.Middle East & North AfricaMiddle East & North Africa (excluding high income)Middle East & North Africa (IDA & IBRD countries)Middle incomeMoldovaMongoliaMontenegroMoroccoMozambiqueMyanmarNamibiaNauruNepalNetherlandsNew ZealandNicaraguaNigerNigeriaNorth AmericaNorwayOECD membersOmanOther small statesPacific island small statesPakistanPalauPanamaPapua New GuineaParaguayPeruPhilippinesPolandPortugalPost-demographic dividendPre-demographic dividendPuerto RicoQatarRomaniaRussian FederationRwandaSamoaSan MarinoSao Tome and PrincipeSaudi ArabiaSenegalSerbiaSeychellesSierra LeoneSlovak RepublicSloveniaSmall statesSolomon IslandsSomaliaSouth AfricaSouth AsiaSouth Asia (IDA & IBRD)South SudanSpainSri LankaSt. Kitts and NevisSt. LuciaSt. Vincent and the GrenadinesSub-Saharan Africa Sub-Saharan Africa (excluding high income)Sub-Saharan Africa (IDA & IBRD countries)SudanSurinameSwazilandSwedenSwitzerlandSyrian Arab RepublicTajikistanTanzaniaThailandTimor-LesteTogoTongaTrinidad and TobagoTunisiaTurkeyTurkmenistanTuvaluUgandaUkraineUnited Arab EmiratesUnited KingdomUnited StatesUpper middle incomeUruguayUzbekistanVanuatuVenezuela, RBVietnamWest Bank and GazaWorldYemen, Rep.ZambiaZimbabwe Linea del tempo:
Questa scala temporale mostra un grafico dal 1971 anno al 2015 anno. Middle East & North Africa. I dati fino ad 1970 anno non disponibili. Il numero di osservazioni attuali secondo i date: 45.
La fonte (nome):
Indicatori dello sviluppo mondiale
La fonte (organizzazione):
UNESCO Institute for Statistics
Categorie:
Education
sono stati aggiornati
23 apr 2017 anni
Indicatori delle variazioni dei valori per anni
Minima:
72.072
1 gen 1971 anni
Massimo:
107.449
1 gen 2014 anni
Alla data di osservazione
Valore
Variazione assoluta
La variazione rispetto al valore precedente
1 gen 1971 anni
72.072
+72.072
0.0%
1 gen 1972 anni
72.077
+0.005
0.01%
1 gen 1973 anni
74.764
+2.688
3.73%
1 gen 1974 anni
76.44
+1.676
2.24%
1 gen 1975 anni
77.183
+0.742
0.97%
1 gen 1976 anni
79.968
+2.785
3.61%
1 gen 1977 anni
82.646
+2.678
3.35%
1 gen 1978 anni
84.262
+1.616
1.95%
1 gen 1979 anni
85.247
+0.985
1.17%
1 gen 1980 anni
84.278
-0.969
-1.14%
1 gen 1981 anni
87.02
+2.742
3.25%
1 gen 1982 anni
86.485
-0.535
-0.61%
1 gen 1983 anni
88.325
+1.839
2.13%
1 gen 1984 anni
89.292
+0.968
1.1%
1 gen 1985 anni
90.343
+1.051
1.18%
1 gen 1986 anni
90.123
-0.22
-0.24%
1 gen 1987 anni
90.908
+0.784
0.87%
1 gen 1988 anni
91.826
+0.918
1.01%
1 gen 1989 anni
92.464
+0.638
0.69%
1 gen 1990 anni
92.261
-0.203
-0.22%
1 gen 1991 anni
93.427
+1.166
1.26%
1 gen 1992 anni
94.115
+0.689
0.74%
1 gen 1993 anni
91.923
-2.192
-2.33%
1 gen 1994 anni
92.11
+0.186
0.2%
1 gen 1995 anni
93.772
+1.663
1.81%
1 gen 1996 anni
92.24
-1.533
-1.63%
1 gen 1997 anni
94.001
+1.761
1.91%
1 gen 1998 anni
94.0
-0.001
0.0%
1 gen 1999 anni
94.703
+0.702
0.75%
1 gen 2000 anni
95.462
+0.76
0.8%
1 gen 2001 anni
96.264
+0.801
0.84%
1 gen 2002 anni
97.505
+1.241
1.29%
1 gen 2003 anni
98.939
+1.435
1.47%
1 gen 2004 anni
100.257
+1.318
1.33%
1 gen 2005 anni
101.054
+0.797
0.79%
1 gen 2006 anni
101.495
+0.441
0.44%
1 gen 2007 anni
102.724
+1.229
1.21%
1 gen 2008 anni
103.808
+1.084
1.06%
1 gen 2009 anni
104.343
+0.535
0.52%
1 gen 2010 anni
105.223
+0.88
0.84%
1 gen 2011 anni
105.902
+0.679
0.65%
1 gen 2012 anni
105.666
-0.236
-0.22%
1 gen 2013 anni
107.156
+1.49
1.41%
1 gen 2014 anni
107.449
+0.293
0.27%
1 gen 2015 anni
105.261
-2.189
-2.04%
Classificazione dei paesi secondo i statistiche attuali per anni


Commenti: