29
/it/
it
AIzaSyAYiBZKx7MnpbEhh9jyipgxe19OcubqV5w
April 1, 2024
57628
South Asia
SAS
false
2
1
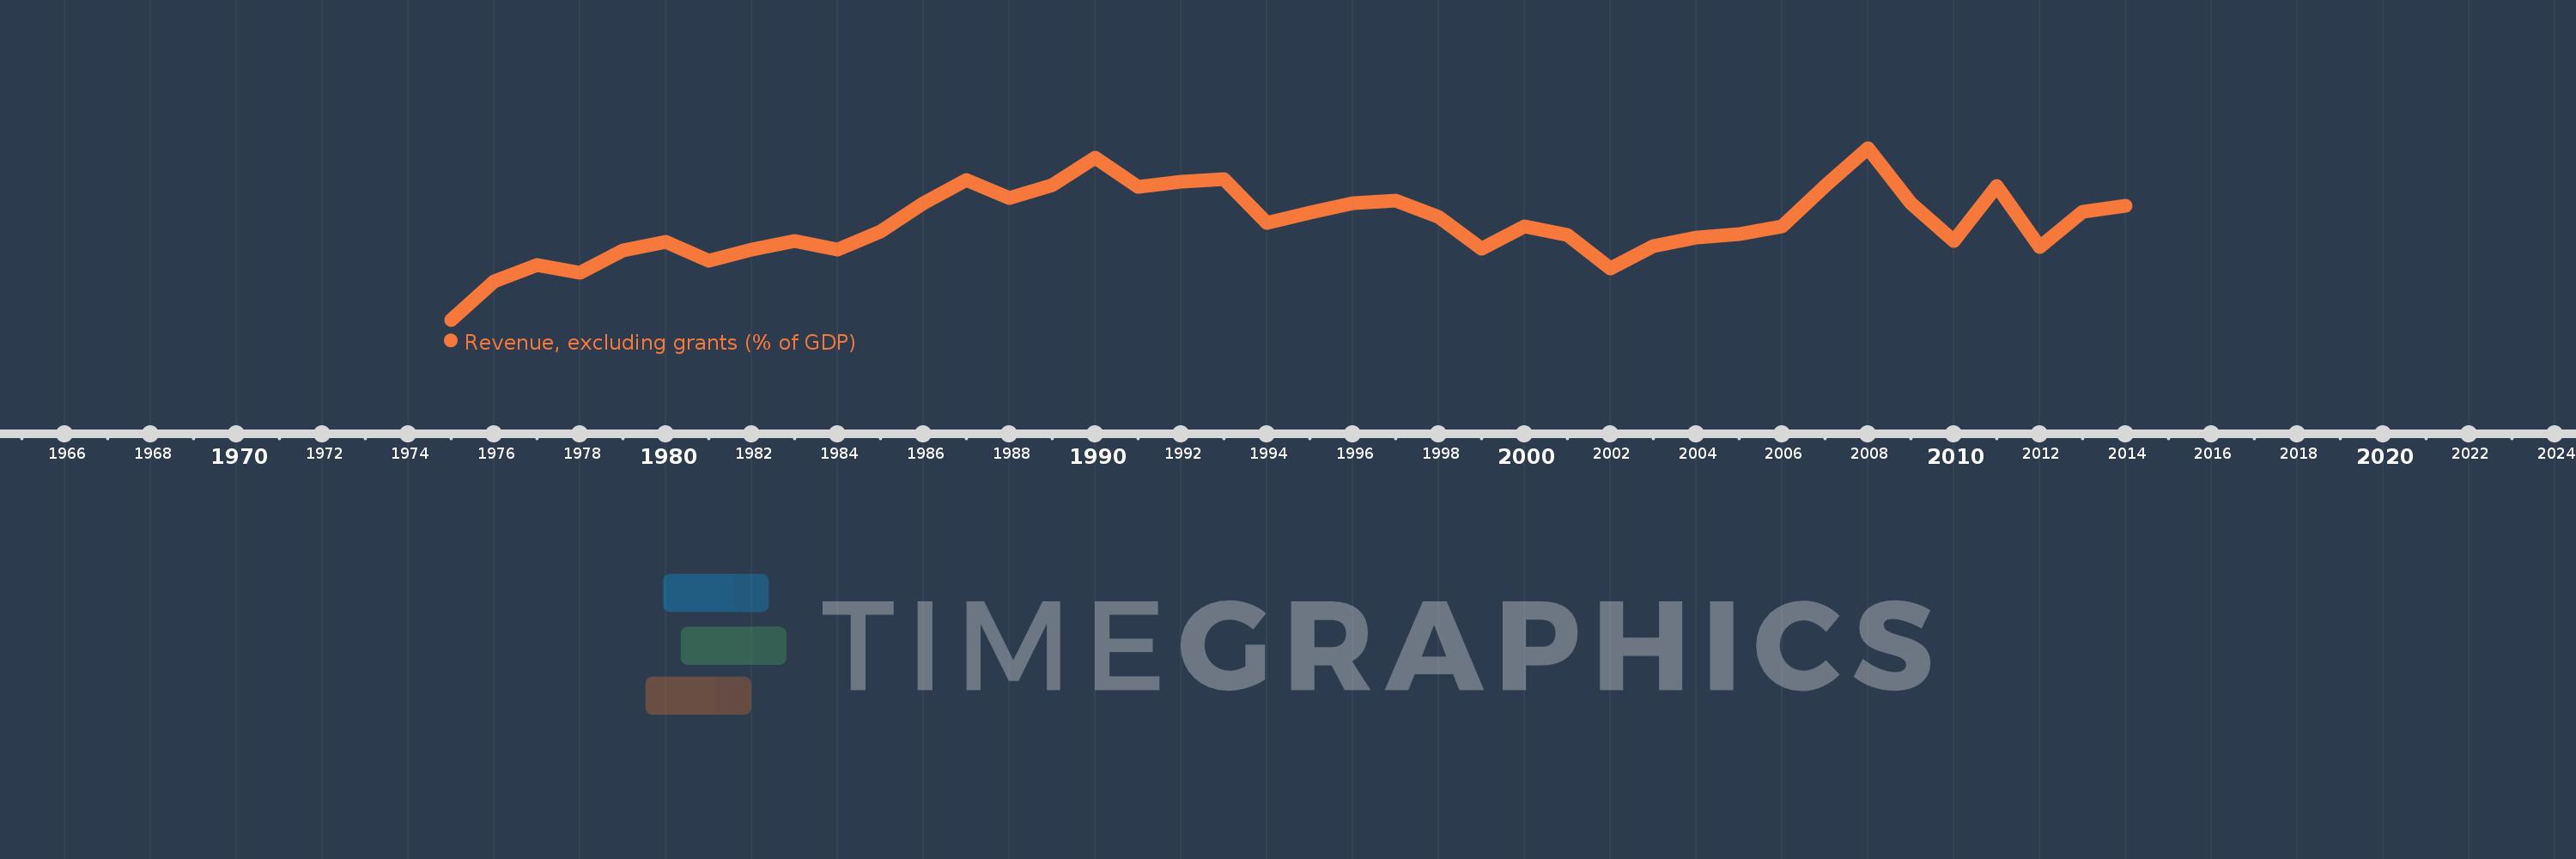
Revenue, excluding grants (% of GDP)
2014,2013,2012,2011,2010,2009,2008,2007,2006,2005,2004,2003,2002,2001,2000,1999,1998,1997,1996,1995,1994,1993,1992,1991,1990,1989,1988,1987,1986,1985,1984,1983,1982,1981,1980,1979,1978,1977,1976,1975
Queste statistiche in altri paesi:
AfghanistanAlbaniaAlgeriaAngolaAntigua and BarbudaArgentinaArmeniaAustraliaAustriaAzerbaijanBahamas, TheBahrainBangladeshBarbadosBelarusBelgiumBelizeBeninBhutanBoliviaBosnia and HerzegovinaBotswanaBrazilBulgariaBurkina FasoBurundiCabo VerdeCambodiaCanadaCaribbean small statesCentral African RepublicCentral Europe and the BalticsChileChinaColombiaCongo, Dem. Rep.Congo, Rep.Costa RicaCote d'IvoireCroatiaCyprusCzech RepublicDenmarkDominicaDominican RepublicEarly-demographic dividendEast Asia & PacificEast Asia & Pacific (excluding high income)East Asia & Pacific (IDA & IBRD countries)Egypt, Arab Rep.El SalvadorEquatorial GuineaEstoniaEthiopiaEuro areaEurope & Central AsiaEurope & Central Asia (excluding high income)Europe & Central Asia (IDA & IBRD countries)European UnionFijiFinlandFranceGambia, TheGeorgiaGermanyGhanaGreeceGrenadaGuatemalaHeavily indebted poor countries (HIPC)High incomeHondurasHong Kong SAR, ChinaHungaryIBRD onlyIcelandIDA & IBRD totalIDA blendIDA onlyIDA totalIndiaIndonesiaIran, Islamic Rep.IraqIrelandIsraelItalyJamaicaJapanJordanKazakhstanKenyaKiribatiKorea, Rep.KuwaitKyrgyz RepublicLao PDRLate-demographic dividendLatin America & Caribbean Latin America & Caribbean (excluding high income)Latin America & the Caribbean (IDA & IBRD countries)LatviaLeast developed countries: UN classificationLebanonLesothoLiberiaLithuaniaLow & middle incomeLow incomeLower middle incomeLuxembourgMacao SAR, ChinaMacedonia, FYRMadagascarMalawiMalaysiaMaldivesMaliMaltaMauritiusMexicoMicronesia, Fed. Sts.Middle East & North Africa (excluding high income)Middle East & North Africa (IDA & IBRD countries)Middle incomeMoldovaMongoliaMoroccoMozambiqueMyanmarNamibiaNepalNetherlandsNew ZealandNicaraguaNigeriaNorth AmericaNorwayOECD membersOmanOther small statesPacific island small statesPakistanPanamaPapua New GuineaParaguayPeruPhilippinesPolandPortugalPost-demographic dividendPre-demographic dividendQatarRomaniaRussian FederationRwandaSamoaSan MarinoSao Tome and PrincipeSenegalSerbiaSeychellesSierra LeoneSingaporeSlovak RepublicSloveniaSmall statesSolomon IslandsSouth AfricaSouth AsiaSouth Asia (IDA & IBRD)SpainSri LankaSt. Kitts and NevisSt. LuciaSt. Vincent and the GrenadinesSub-Saharan Africa Sub-Saharan Africa (excluding high income)Sub-Saharan Africa (IDA & IBRD countries)SurinameSwazilandSwedenSwitzerlandSyrian Arab RepublicTajikistanTanzaniaThailandTimor-LesteTogoTrinidad and TobagoTunisiaTurkeyUgandaUkraineUnited Arab EmiratesUnited KingdomUnited StatesUpper middle incomeUruguayVanuatuVenezuela, RBVietnamWest Bank and GazaWorldYemen, Rep.ZambiaZimbabwe Linea del tempo:
Questa scala temporale mostra un grafico dal 1975 anno al 2014 anno. South Asia. I dati fino ad 1974 anno non disponibili. Il numero di osservazioni attuali secondo i date: 40.
La fonte (nome):
Indicatori dello sviluppo mondiale
La fonte (organizzazione):
International Monetary Fund, Government Finance Statistics Yearbook and data files, and World Bank and OECD GDP estimates.
Categorie:
Economy & Growth, Public Sector
sono stati aggiornati
23 apr 2017 anni
Indicatori delle variazioni dei valori per anni
Minima:
9.717
1 gen 1975 anni
Massimo:
14.143
1 gen 2008 anni
Alla data di osservazione
Valore
Variazione assoluta
La variazione rispetto al valore precedente
1 gen 1975 anni
9.717
+9.717
0.0%
1 gen 1976 anni
10.709
+0.992
10.21%
1 gen 1977 anni
11.136
+0.427
3.99%
1 gen 1978 anni
10.935
-0.201
-1.8%
1 gen 1979 anni
11.508
+0.572
5.23%
1 gen 1980 anni
11.725
+0.217
1.88%
1 gen 1981 anni
11.236
-0.489
-4.17%
1 gen 1982 anni
11.527
+0.291
2.59%
1 gen 1983 anni
11.752
+0.225
1.95%
1 gen 1984 anni
11.518
-0.234
-1.99%
1 gen 1985 anni
11.981
+0.463
4.02%
1 gen 1986 anni
12.724
+0.743
6.2%
1 gen 1987 anni
13.325
+0.601
4.73%
1 gen 1988 anni
12.852
-0.473
-3.55%
1 gen 1989 anni
13.184
+0.331
2.58%
1 gen 1990 anni
13.887
+0.704
5.34%
1 gen 1991 anni
13.14
-0.748
-5.38%
1 gen 1992 anni
13.275
+0.135
1.03%
1 gen 1993 anni
13.331
+0.056
0.42%
1 gen 1994 anni
12.205
-1.126
-8.44%
1 gen 1995 anni
12.478
+0.273
2.23%
1 gen 1996 anni
12.727
+0.25
2.0%
1 gen 1997 anni
12.78
+0.053
0.41%
1 gen 1998 anni
12.363
-0.417
-3.27%
1 gen 1999 anni
11.546
-0.817
-6.61%
1 gen 2000 anni
12.123
+0.578
5.0%
1 gen 2001 anni
11.91
-0.213
-1.76%
1 gen 2002 anni
11.049
-0.861
-7.23%
1 gen 2003 anni
11.617
+0.568
5.14%
1 gen 2004 anni
11.828
+0.211
1.82%
1 gen 2005 anni
11.915
+0.087
0.74%
1 gen 2006 anni
12.116
+0.201
1.69%
1 gen 2007 anni
13.164
+1.048
8.65%
1 gen 2008 anni
14.143
+0.979
7.44%
1 gen 2009 anni
12.715
-1.428
-10.1%
1 gen 2010 anni
11.742
-0.973
-7.65%
1 gen 2011 anni
13.154
+1.412
12.03%
1 gen 2012 anni
11.584
-1.57
-11.93%
1 gen 2013 anni
12.506
+0.921
7.95%
1 gen 2014 anni
12.656
+0.15
1.2%
Classificazione dei paesi secondo i statistiche attuali per anni


Commenti: