29
/it/
it
AIzaSyAYiBZKx7MnpbEhh9jyipgxe19OcubqV5w
April 1, 2024
157916
Iran, Islamic Rep.
IRN
true
2
1
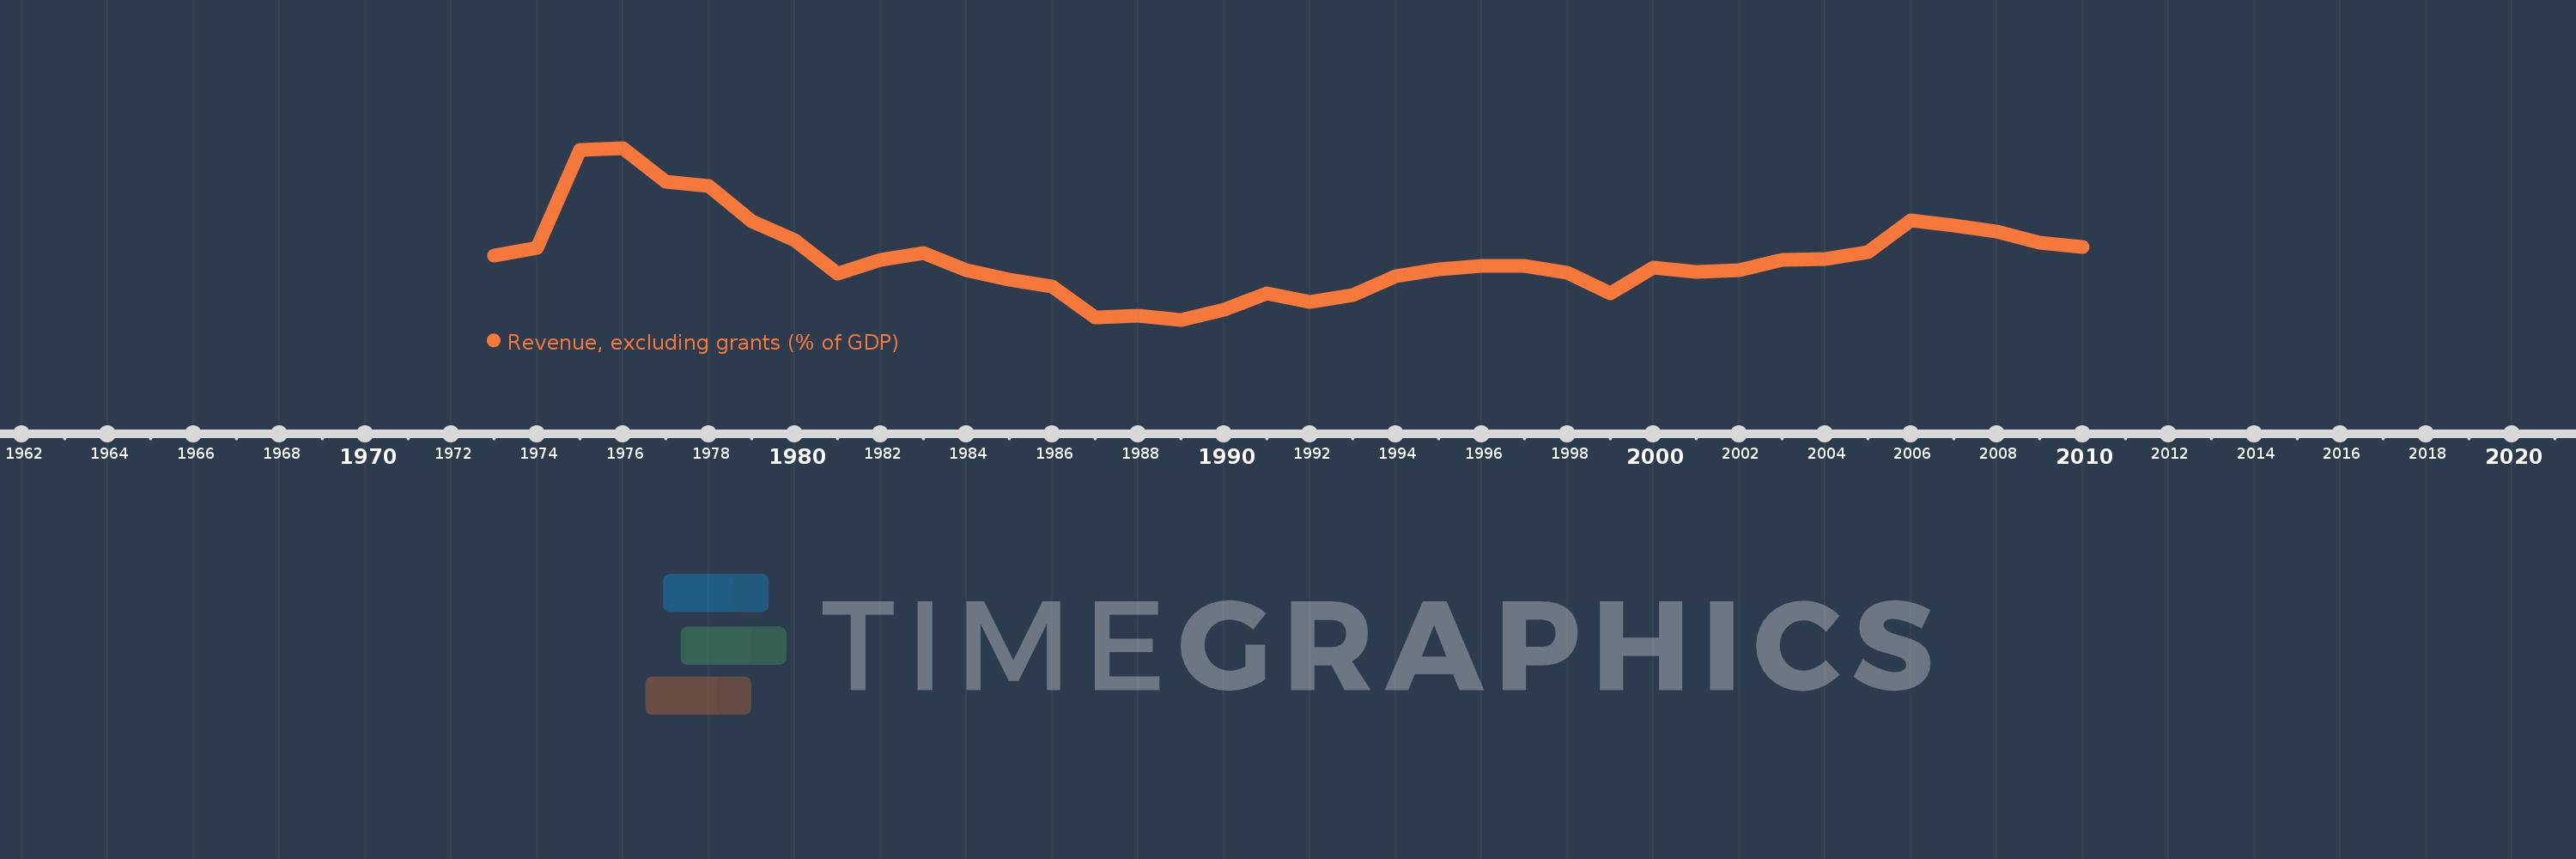
Revenue, excluding grants (% of GDP)
2010,2009,2008,2007,2006,2005,2004,2003,2002,2001,2000,1999,1998,1997,1996,1995,1994,1993,1992,1991,1990,1989,1988,1987,1986,1985,1984,1983,1982,1981,1980,1979,1978,1977,1976,1975,1974,1973
Queste statistiche in altri paesi:
AfghanistanAlbaniaAlgeriaAngolaAntigua and BarbudaArgentinaArmeniaAustraliaAustriaAzerbaijanBahamas, TheBahrainBangladeshBarbadosBelarusBelgiumBelizeBeninBhutanBoliviaBosnia and HerzegovinaBotswanaBrazilBulgariaBurkina FasoBurundiCabo VerdeCambodiaCanadaCaribbean small statesCentral African RepublicCentral Europe and the BalticsChileChinaColombiaCongo, Dem. Rep.Congo, Rep.Costa RicaCote d'IvoireCroatiaCyprusCzech RepublicDenmarkDominicaDominican RepublicEarly-demographic dividendEast Asia & PacificEast Asia & Pacific (excluding high income)East Asia & Pacific (IDA & IBRD countries)Egypt, Arab Rep.El SalvadorEquatorial GuineaEstoniaEthiopiaEuro areaEurope & Central AsiaEurope & Central Asia (excluding high income)Europe & Central Asia (IDA & IBRD countries)European UnionFijiFinlandFranceGambia, TheGeorgiaGermanyGhanaGreeceGrenadaGuatemalaHeavily indebted poor countries (HIPC)High incomeHondurasHong Kong SAR, ChinaHungaryIBRD onlyIcelandIDA & IBRD totalIDA blendIDA onlyIDA totalIndiaIndonesiaIran, Islamic Rep.IraqIrelandIsraelItalyJamaicaJapanJordanKazakhstanKenyaKiribatiKorea, Rep.KuwaitKyrgyz RepublicLao PDRLate-demographic dividendLatin America & Caribbean Latin America & Caribbean (excluding high income)Latin America & the Caribbean (IDA & IBRD countries)LatviaLeast developed countries: UN classificationLebanonLesothoLiberiaLithuaniaLow & middle incomeLow incomeLower middle incomeLuxembourgMacao SAR, ChinaMacedonia, FYRMadagascarMalawiMalaysiaMaldivesMaliMaltaMauritiusMexicoMicronesia, Fed. Sts.Middle East & North Africa (excluding high income)Middle East & North Africa (IDA & IBRD countries)Middle incomeMoldovaMongoliaMoroccoMozambiqueMyanmarNamibiaNepalNetherlandsNew ZealandNicaraguaNigeriaNorth AmericaNorwayOECD membersOmanOther small statesPacific island small statesPakistanPanamaPapua New GuineaParaguayPeruPhilippinesPolandPortugalPost-demographic dividendPre-demographic dividendQatarRomaniaRussian FederationRwandaSamoaSan MarinoSao Tome and PrincipeSenegalSerbiaSeychellesSierra LeoneSingaporeSlovak RepublicSloveniaSmall statesSolomon IslandsSouth AfricaSouth AsiaSouth Asia (IDA & IBRD)SpainSri LankaSt. Kitts and NevisSt. LuciaSt. Vincent and the GrenadinesSub-Saharan Africa Sub-Saharan Africa (excluding high income)Sub-Saharan Africa (IDA & IBRD countries)SurinameSwazilandSwedenSwitzerlandSyrian Arab RepublicTajikistanTanzaniaThailandTimor-LesteTogoTrinidad and TobagoTunisiaTurkeyUgandaUkraineUnited Arab EmiratesUnited KingdomUnited StatesUpper middle incomeUruguayVanuatuVenezuela, RBVietnamWest Bank and GazaWorldYemen, Rep.ZambiaZimbabwe Linea del tempo:
Questa scala temporale mostra un grafico dal 1973 anno al 2010 anno. Iran, Islamic Rep.. I dati fino ad 1972 anno non disponibili. Il numero di osservazioni attuali secondo i date: 38.
La fonte (nome):
Indicatori dello sviluppo mondiale
La fonte (organizzazione):
International Monetary Fund, Government Finance Statistics Yearbook and data files, and World Bank and OECD GDP estimates.
Categorie:
Economy & Growth, Public Sector
sono stati aggiornati
23 apr 2017 anni
Indicatori delle variazioni dei valori per anni
Minima:
12.128
1 gen 1989 anni
Massimo:
46.093
1 gen 1976 anni
Alla data di osservazione
Valore
Variazione assoluta
La variazione rispetto al valore precedente
1 gen 1973 anni
24.781
+24.781
0.0%
1 gen 1974 anni
26.267
+1.486
6.0%
1 gen 1975 anni
45.669
+19.402
73.86%
1 gen 1976 anni
46.093
+0.424
0.93%
1 gen 1977 anni
39.491
-6.602
-14.32%
1 gen 1978 anni
38.549
-0.943
-2.39%
1 gen 1979 anni
31.601
-6.947
-18.02%
1 gen 1980 anni
27.95
-3.651
-11.55%
1 gen 1981 anni
21.173
-6.777
-24.25%
1 gen 1982 anni
23.904
+2.731
12.9%
1 gen 1983 anni
25.368
+1.464
6.13%
1 gen 1984 anni
21.95
-3.418
-13.48%
1 gen 1985 anni
20.041
-1.909
-8.7%
1 gen 1986 anni
18.748
-1.293
-6.45%
1 gen 1987 anni
12.603
-6.145
-32.78%
1 gen 1988 anni
12.931
+0.329
2.61%
1 gen 1989 anni
12.128
-0.804
-6.22%
1 gen 1990 anni
14.064
+1.937
15.97%
1 gen 1991 anni
17.419
+3.355
23.86%
1 gen 1992 anni
15.584
-1.835
-10.54%
1 gen 1993 anni
17.083
+1.499
9.62%
1 gen 1994 anni
20.663
+3.58
20.96%
1 gen 1995 anni
22.151
+1.488
7.2%
1 gen 1996 anni
22.75
+0.599
2.7%
1 gen 1997 anni
22.835
+0.085
0.37%
1 gen 1998 anni
21.501
-1.334
-5.84%
1 gen 1999 anni
17.321
-4.18
-19.44%
1 gen 2000 anni
22.489
+5.168
29.83%
1 gen 2001 anni
21.629
-0.86
-3.82%
1 gen 2002 anni
21.951
+0.322
1.49%
1 gen 2003 anni
23.994
+2.043
9.31%
1 gen 2004 anni
24.063
+0.07
0.29%
1 gen 2005 anni
25.543
+1.48
6.15%
1 gen 2006 anni
31.849
+6.306
24.69%
1 gen 2007 anni
30.842
-1.007
-3.16%
1 gen 2008 anni
29.506
-1.335
-4.33%
1 gen 2009 anni
27.445
-2.062
-6.99%
1 gen 2010 anni
26.484
-0.96
-3.5%
Classificazione dei paesi secondo i statistiche attuali per anni


Commenti: