29
/it/
it
AIzaSyAYiBZKx7MnpbEhh9jyipgxe19OcubqV5w
April 1, 2024
268664
Tunisia
TUN
true
2
1
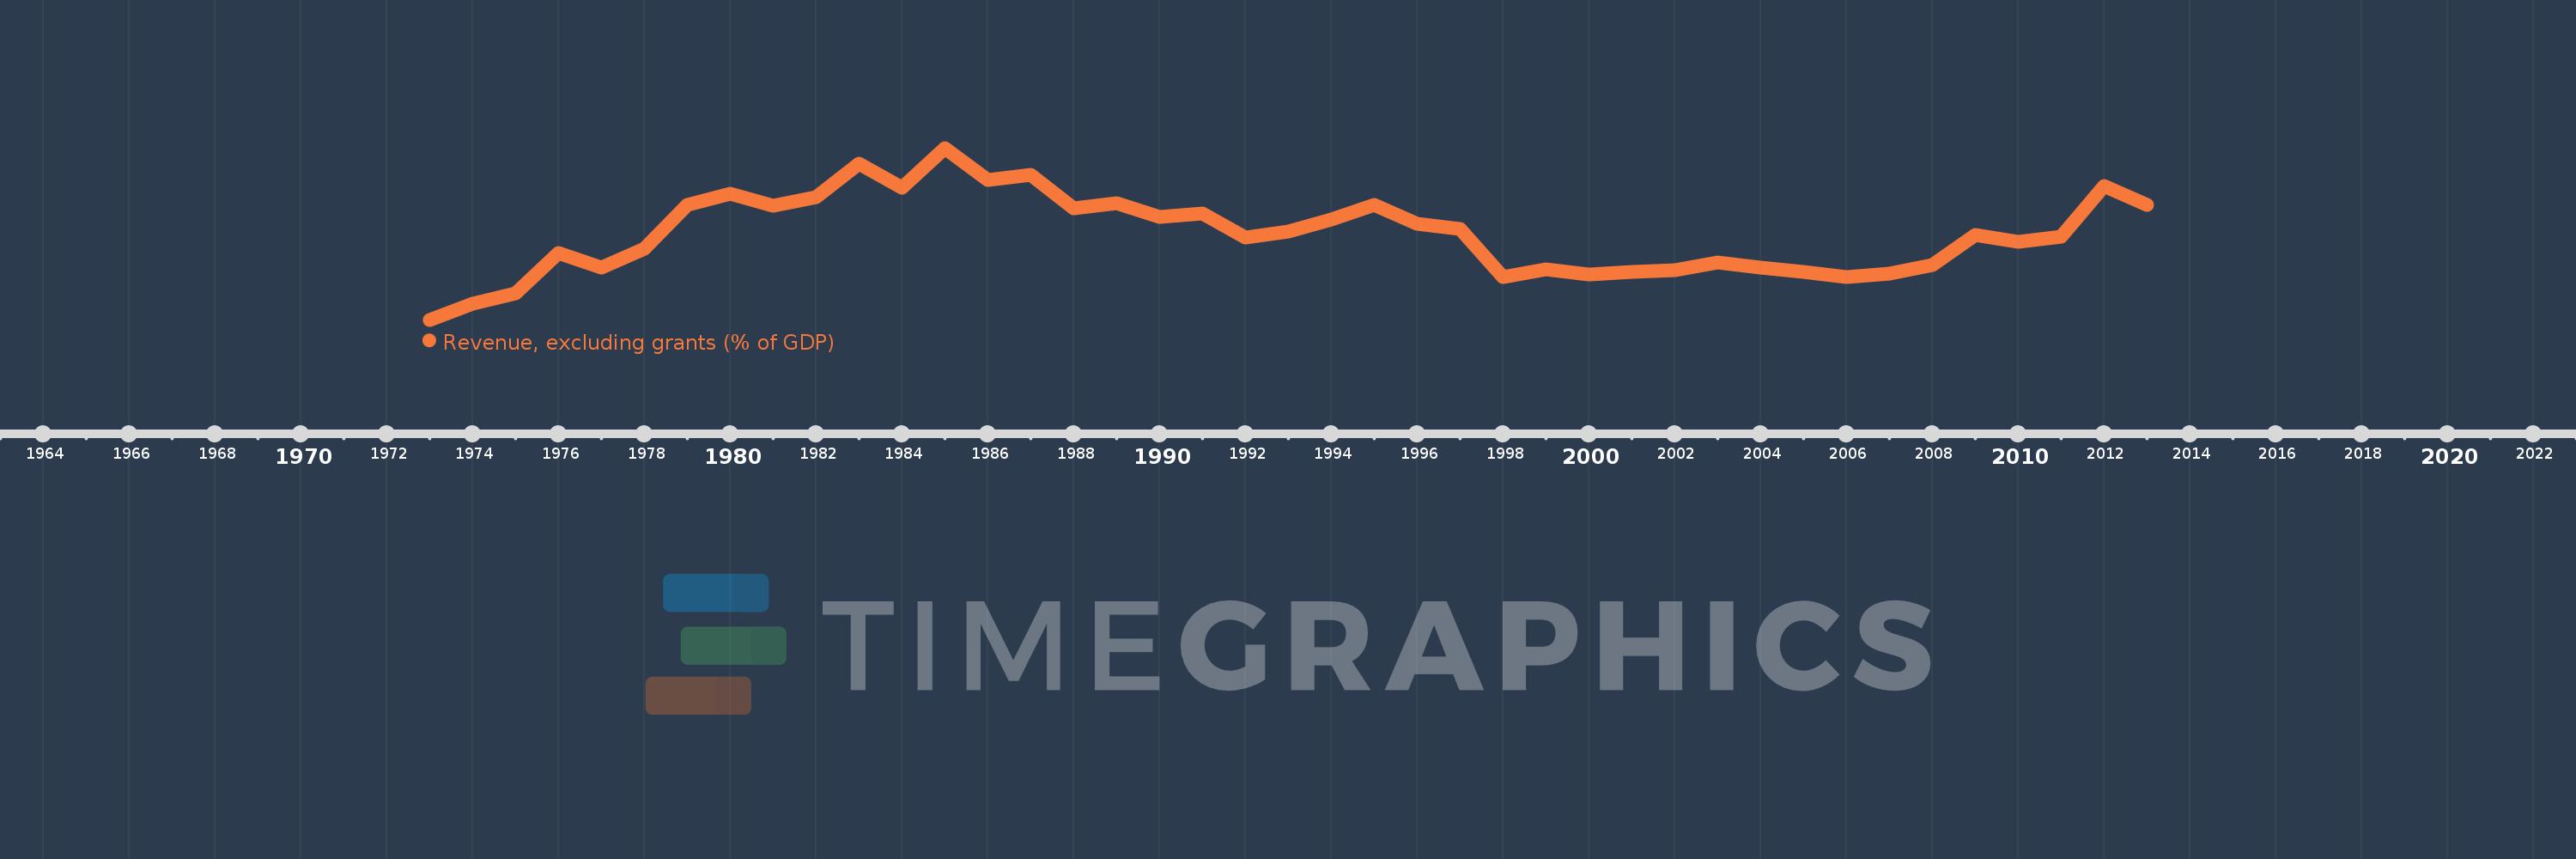
Revenue, excluding grants (% of GDP)
2013,2012,2011,2010,2009,2008,2007,2006,2005,2004,2003,2002,2001,2000,1999,1998,1997,1996,1995,1994,1993,1992,1991,1990,1989,1988,1987,1986,1985,1984,1983,1982,1981,1980,1979,1978,1977,1976,1975,1974,1973
Queste statistiche in altri paesi:
AfghanistanAlbaniaAlgeriaAngolaAntigua and BarbudaArgentinaArmeniaAustraliaAustriaAzerbaijanBahamas, TheBahrainBangladeshBarbadosBelarusBelgiumBelizeBeninBhutanBoliviaBosnia and HerzegovinaBotswanaBrazilBulgariaBurkina FasoBurundiCabo VerdeCambodiaCanadaCaribbean small statesCentral African RepublicCentral Europe and the BalticsChileChinaColombiaCongo, Dem. Rep.Congo, Rep.Costa RicaCote d'IvoireCroatiaCyprusCzech RepublicDenmarkDominicaDominican RepublicEarly-demographic dividendEast Asia & PacificEast Asia & Pacific (excluding high income)East Asia & Pacific (IDA & IBRD countries)Egypt, Arab Rep.El SalvadorEquatorial GuineaEstoniaEthiopiaEuro areaEurope & Central AsiaEurope & Central Asia (excluding high income)Europe & Central Asia (IDA & IBRD countries)European UnionFijiFinlandFranceGambia, TheGeorgiaGermanyGhanaGreeceGrenadaGuatemalaHeavily indebted poor countries (HIPC)High incomeHondurasHong Kong SAR, ChinaHungaryIBRD onlyIcelandIDA & IBRD totalIDA blendIDA onlyIDA totalIndiaIndonesiaIran, Islamic Rep.IraqIrelandIsraelItalyJamaicaJapanJordanKazakhstanKenyaKiribatiKorea, Rep.KuwaitKyrgyz RepublicLao PDRLate-demographic dividendLatin America & Caribbean Latin America & Caribbean (excluding high income)Latin America & the Caribbean (IDA & IBRD countries)LatviaLeast developed countries: UN classificationLebanonLesothoLiberiaLithuaniaLow & middle incomeLow incomeLower middle incomeLuxembourgMacao SAR, ChinaMacedonia, FYRMadagascarMalawiMalaysiaMaldivesMaliMaltaMauritiusMexicoMicronesia, Fed. Sts.Middle East & North Africa (excluding high income)Middle East & North Africa (IDA & IBRD countries)Middle incomeMoldovaMongoliaMoroccoMozambiqueMyanmarNamibiaNepalNetherlandsNew ZealandNicaraguaNigeriaNorth AmericaNorwayOECD membersOmanOther small statesPacific island small statesPakistanPanamaPapua New GuineaParaguayPeruPhilippinesPolandPortugalPost-demographic dividendPre-demographic dividendQatarRomaniaRussian FederationRwandaSamoaSan MarinoSao Tome and PrincipeSenegalSerbiaSeychellesSierra LeoneSingaporeSlovak RepublicSloveniaSmall statesSolomon IslandsSouth AfricaSouth AsiaSouth Asia (IDA & IBRD)SpainSri LankaSt. Kitts and NevisSt. LuciaSt. Vincent and the GrenadinesSub-Saharan Africa Sub-Saharan Africa (excluding high income)Sub-Saharan Africa (IDA & IBRD countries)SurinameSwazilandSwedenSwitzerlandSyrian Arab RepublicTajikistanTanzaniaThailandTimor-LesteTogoTrinidad and TobagoTunisiaTurkeyUgandaUkraineUnited Arab EmiratesUnited KingdomUnited StatesUpper middle incomeUruguayVanuatuVenezuela, RBVietnamWest Bank and GazaWorldYemen, Rep.ZambiaZimbabwe Linea del tempo:
Questa scala temporale mostra un grafico dal 1973 anno al 2013 anno. Tunisia. I dati fino ad 1972 anno non disponibili. Il numero di osservazioni attuali secondo i date: 41.
La fonte (nome):
Indicatori dello sviluppo mondiale
La fonte (organizzazione):
International Monetary Fund, Government Finance Statistics Yearbook and data files, and World Bank and OECD GDP estimates.
Categorie:
Economy & Growth, Public Sector
sono stati aggiornati
23 apr 2017 anni
Indicatori delle variazioni dei valori per anni
Minima:
23.044
1 gen 1973 anni
Massimo:
35.478
1 gen 1985 anni
Alla data di osservazione
Valore
Variazione assoluta
La variazione rispetto al valore precedente
1 gen 1973 anni
23.044
+23.044
0.0%
1 gen 1974 anni
24.207
+1.163
5.05%
1 gen 1975 anni
24.932
+0.725
2.99%
1 gen 1976 anni
27.886
+2.953
11.85%
1 gen 1977 anni
26.824
-1.062
-3.81%
1 gen 1978 anni
28.158
+1.335
4.98%
1 gen 1979 anni
31.362
+3.204
11.38%
1 gen 1980 anni
32.139
+0.777
2.48%
1 gen 1981 anni
31.309
-0.83
-2.58%
1 gen 1982 anni
31.905
+0.596
1.9%
1 gen 1983 anni
34.31
+2.405
7.54%
1 gen 1984 anni
32.584
-1.726
-5.03%
1 gen 1985 anni
35.478
+2.894
8.88%
1 gen 1986 anni
33.175
-2.303
-6.49%
1 gen 1987 anni
33.52
+0.346
1.04%
1 gen 1988 anni
31.078
-2.443
-7.29%
1 gen 1989 anni
31.496
+0.418
1.34%
1 gen 1990 anni
30.515
-0.98
-3.11%
1 gen 1991 anni
30.705
+0.19
0.62%
1 gen 1992 anni
28.964
-1.742
-5.67%
1 gen 1993 anni
29.437
+0.473
1.63%
1 gen 1994 anni
30.277
+0.84
2.85%
1 gen 1995 anni
31.333
+1.056
3.49%
1 gen 1996 anni
30.019
-1.314
-4.19%
1 gen 1997 anni
29.598
-0.421
-1.4%
1 gen 1998 anni
26.159
-3.439
-11.62%
1 gen 1999 anni
26.699
+0.54
2.07%
1 gen 2000 anni
26.329
-0.371
-1.39%
1 gen 2001 anni
26.476
+0.148
0.56%
1 gen 2002 anni
26.662
+0.185
0.7%
1 gen 2003 anni
27.181
+0.519
1.95%
1 gen 2004 anni
26.789
-0.391
-1.44%
1 gen 2005 anni
26.508
-0.282
-1.05%
1 gen 2006 anni
26.153
-0.354
-1.34%
1 gen 2007 anni
26.41
+0.257
0.98%
1 gen 2008 anni
26.98
+0.57
2.16%
1 gen 2009 anni
29.179
+2.2
8.15%
1 gen 2010 anni
28.661
-0.519
-1.78%
1 gen 2011 anni
29.025
+0.365
1.27%
1 gen 2012 anni
32.734
+3.709
12.78%
1 gen 2013 anni
31.38
-1.354
-4.14%
Classificazione dei paesi secondo i statistiche attuali per anni


Commenti: