29
/it/
it
AIzaSyAYiBZKx7MnpbEhh9jyipgxe19OcubqV5w
April 1, 2024
222877
Peru
PER
true
2
1
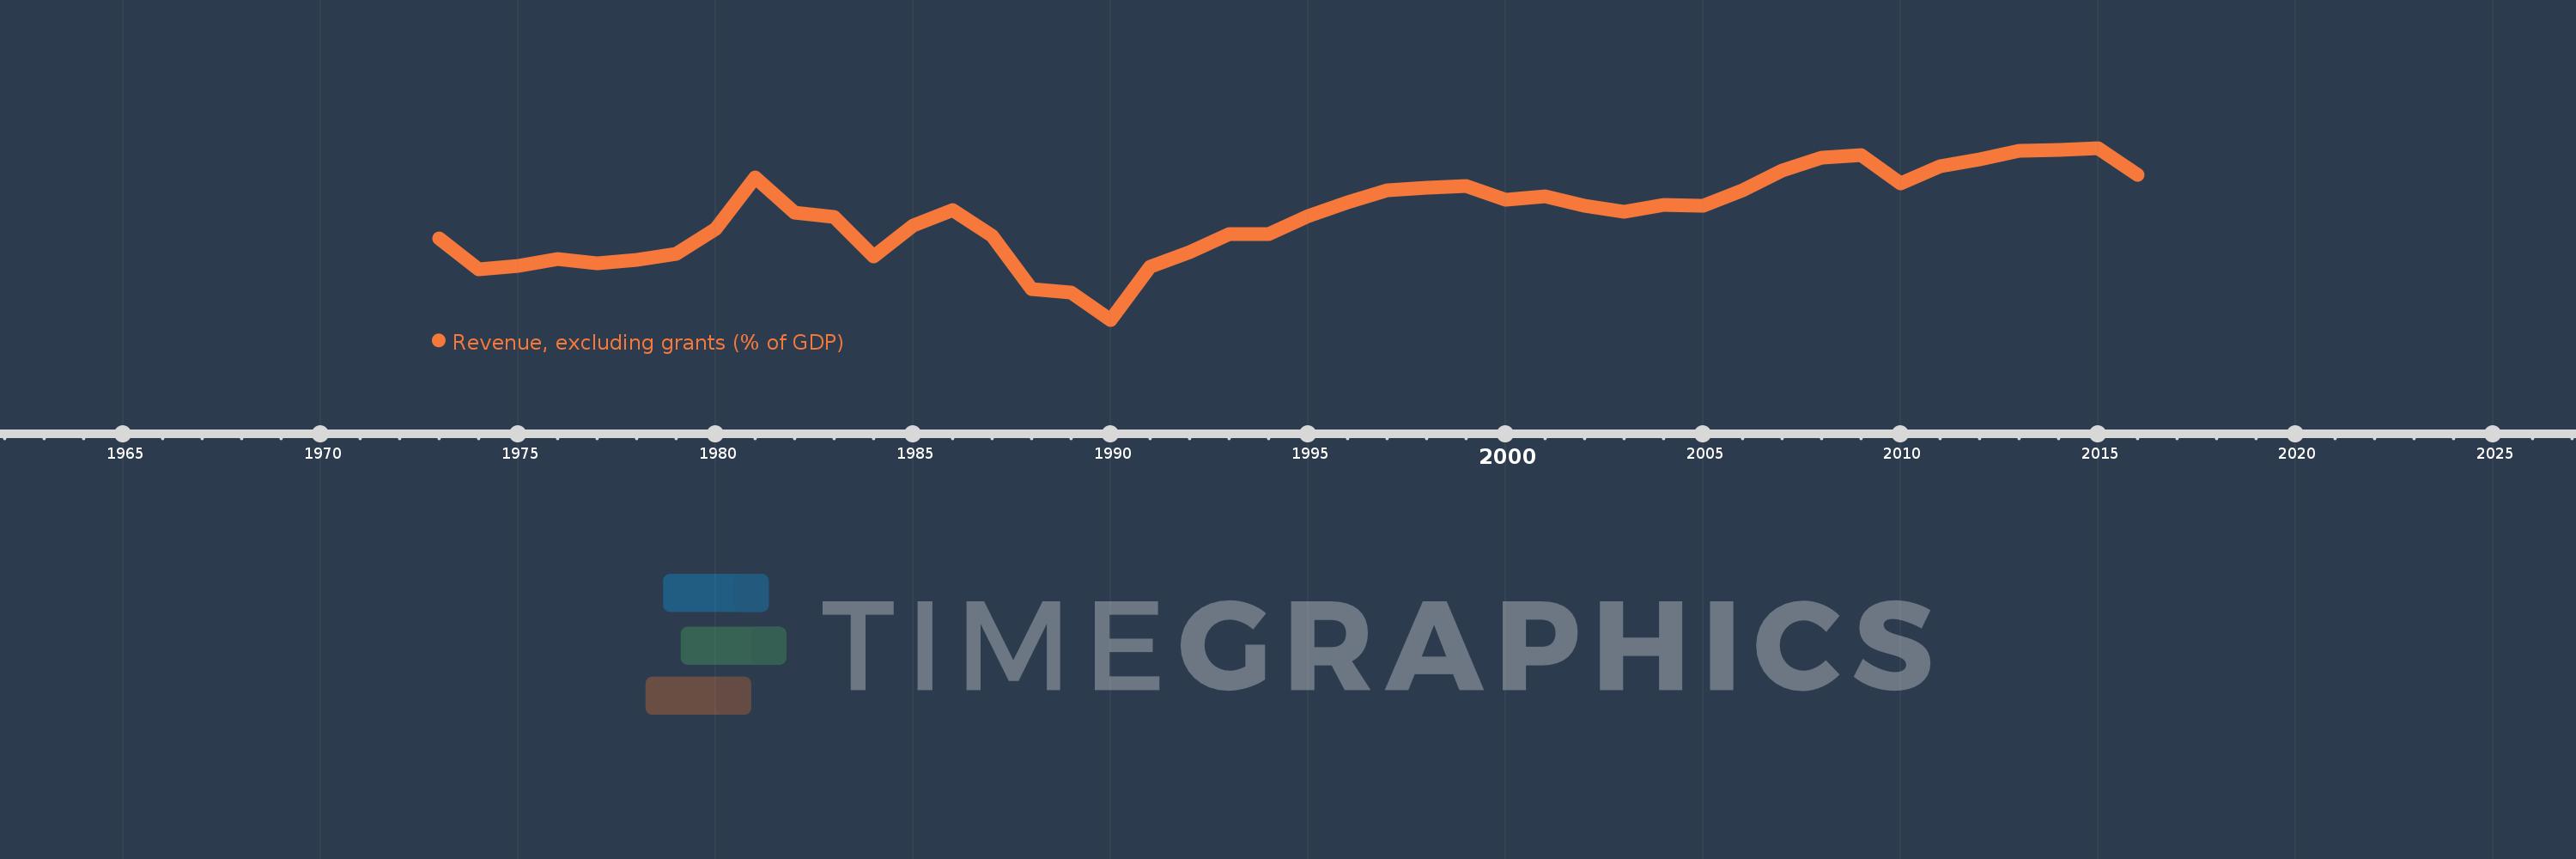
Revenue, excluding grants (% of GDP)
2016,2015,2014,2013,2012,2011,2010,2009,2008,2007,2006,2005,2004,2003,2002,2001,2000,1999,1998,1997,1996,1995,1994,1993,1992,1991,1990,1989,1988,1987,1986,1985,1984,1983,1982,1981,1980,1979,1978,1977,1976,1975,1974,1973
Queste statistiche in altri paesi:
AfghanistanAlbaniaAlgeriaAngolaAntigua and BarbudaArgentinaArmeniaAustraliaAustriaAzerbaijanBahamas, TheBahrainBangladeshBarbadosBelarusBelgiumBelizeBeninBhutanBoliviaBosnia and HerzegovinaBotswanaBrazilBulgariaBurkina FasoBurundiCabo VerdeCambodiaCanadaCaribbean small statesCentral African RepublicCentral Europe and the BalticsChileChinaColombiaCongo, Dem. Rep.Congo, Rep.Costa RicaCote d'IvoireCroatiaCyprusCzech RepublicDenmarkDominicaDominican RepublicEarly-demographic dividendEast Asia & PacificEast Asia & Pacific (excluding high income)East Asia & Pacific (IDA & IBRD countries)Egypt, Arab Rep.El SalvadorEquatorial GuineaEstoniaEthiopiaEuro areaEurope & Central AsiaEurope & Central Asia (excluding high income)Europe & Central Asia (IDA & IBRD countries)European UnionFijiFinlandFranceGambia, TheGeorgiaGermanyGhanaGreeceGrenadaGuatemalaHeavily indebted poor countries (HIPC)High incomeHondurasHong Kong SAR, ChinaHungaryIBRD onlyIcelandIDA & IBRD totalIDA blendIDA onlyIDA totalIndiaIndonesiaIran, Islamic Rep.IraqIrelandIsraelItalyJamaicaJapanJordanKazakhstanKenyaKiribatiKorea, Rep.KuwaitKyrgyz RepublicLao PDRLate-demographic dividendLatin America & Caribbean Latin America & Caribbean (excluding high income)Latin America & the Caribbean (IDA & IBRD countries)LatviaLeast developed countries: UN classificationLebanonLesothoLiberiaLithuaniaLow & middle incomeLow incomeLower middle incomeLuxembourgMacao SAR, ChinaMacedonia, FYRMadagascarMalawiMalaysiaMaldivesMaliMaltaMauritiusMexicoMicronesia, Fed. Sts.Middle East & North Africa (excluding high income)Middle East & North Africa (IDA & IBRD countries)Middle incomeMoldovaMongoliaMoroccoMozambiqueMyanmarNamibiaNepalNetherlandsNew ZealandNicaraguaNigeriaNorth AmericaNorwayOECD membersOmanOther small statesPacific island small statesPakistanPanamaPapua New GuineaParaguayPeruPhilippinesPolandPortugalPost-demographic dividendPre-demographic dividendQatarRomaniaRussian FederationRwandaSamoaSan MarinoSao Tome and PrincipeSenegalSerbiaSeychellesSierra LeoneSingaporeSlovak RepublicSloveniaSmall statesSolomon IslandsSouth AfricaSouth AsiaSouth Asia (IDA & IBRD)SpainSri LankaSt. Kitts and NevisSt. LuciaSt. Vincent and the GrenadinesSub-Saharan Africa Sub-Saharan Africa (excluding high income)Sub-Saharan Africa (IDA & IBRD countries)SurinameSwazilandSwedenSwitzerlandSyrian Arab RepublicTajikistanTanzaniaThailandTimor-LesteTogoTrinidad and TobagoTunisiaTurkeyUgandaUkraineUnited Arab EmiratesUnited KingdomUnited StatesUpper middle incomeUruguayVanuatuVenezuela, RBVietnamWest Bank and GazaWorldYemen, Rep.ZambiaZimbabwe Linea del tempo:
Questa scala temporale mostra un grafico dal 1973 anno al 2016 anno. Peru. I dati fino ad 1972 anno non disponibili. Il numero di osservazioni attuali secondo i date: 44.
La fonte (nome):
Indicatori dello sviluppo mondiale
La fonte (organizzazione):
International Monetary Fund, Government Finance Statistics Yearbook and data files, and World Bank and OECD GDP estimates.
Categorie:
Economy & Growth, Public Sector
sono stati aggiornati
23 apr 2017 anni
Indicatori delle variazioni dei valori per anni
Minima:
8.291
1 gen 1990 anni
Massimo:
21.722
1 gen 2015 anni
Alla data di osservazione
Valore
Variazione assoluta
La variazione rispetto al valore precedente
1 gen 1973 anni
14.622
+14.622
0.0%
1 gen 1974 anni
12.221
-2.401
-16.42%
1 gen 1975 anni
12.493
+0.271
2.22%
1 gen 1976 anni
13.021
+0.528
4.23%
1 gen 1977 anni
12.674
-0.346
-2.66%
1 gen 1978 anni
12.978
+0.303
2.39%
1 gen 1979 anni
13.466
+0.488
3.76%
1 gen 1980 anni
15.369
+1.903
14.13%
1 gen 1981 anni
19.451
+4.082
26.56%
1 gen 1982 anni
16.659
-2.792
-14.35%
1 gen 1983 anni
16.345
-0.313
-1.88%
1 gen 1984 anni
13.232
-3.113
-19.05%
1 gen 1985 anni
15.658
+2.425
18.33%
1 gen 1986 anni
16.897
+1.24
7.92%
1 gen 1987 anni
14.822
-2.075
-12.28%
1 gen 1988 anni
10.695
-4.127
-27.84%
1 gen 1989 anni
10.441
-0.254
-2.38%
1 gen 1990 anni
8.291
-2.15
-20.59%
1 gen 1991 anni
12.468
+4.177
50.39%
1 gen 1992 anni
13.548
+1.079
8.66%
1 gen 1993 anni
15.007
+1.459
10.77%
1 gen 1994 anni
14.98
-0.027
-0.18%
1 gen 1995 anni
16.42
+1.439
9.61%
1 gen 1996 anni
17.459
+1.039
6.33%
1 gen 1997 anni
18.383
+0.924
5.3%
1 gen 1998 anni
18.64
+0.257
1.4%
1 gen 1999 anni
18.762
+0.122
0.65%
1 gen 2000 anni
17.699
-1.063
-5.66%
1 gen 2001 anni
17.947
+0.248
1.4%
1 gen 2002 anni
17.231
-0.716
-3.99%
1 gen 2003 anni
16.761
-0.47
-2.73%
1 gen 2004 anni
17.28
+0.519
3.1%
1 gen 2005 anni
17.204
-0.076
-0.44%
1 gen 2006 anni
18.394
+1.19
6.92%
1 gen 2007 anni
19.944
+1.55
8.43%
1 gen 2008 anni
20.971
+1.027
5.15%
1 gen 2009 anni
21.151
+0.181
0.86%
1 gen 2010 anni
18.962
-2.19
-10.35%
1 gen 2011 anni
20.286
+1.324
6.98%
1 gen 2012 anni
20.803
+0.517
2.55%
1 gen 2013 anni
21.513
+0.711
3.42%
1 gen 2014 anni
21.545
+0.031
0.15%
1 gen 2015 anni
21.722
+0.177
0.82%
1 gen 2016 anni
19.608
-2.114
-9.73%
Classificazione dei paesi secondo i statistiche attuali per anni


Commenti: